Prerequisites
Before you begin, make sure you have:- A Grafana account (Grafana Cloud or self-hosted) with access to the dashboard
- Email and password login available for that account
- The full dashboard URL you plan to display
Step-by-Step Configuration
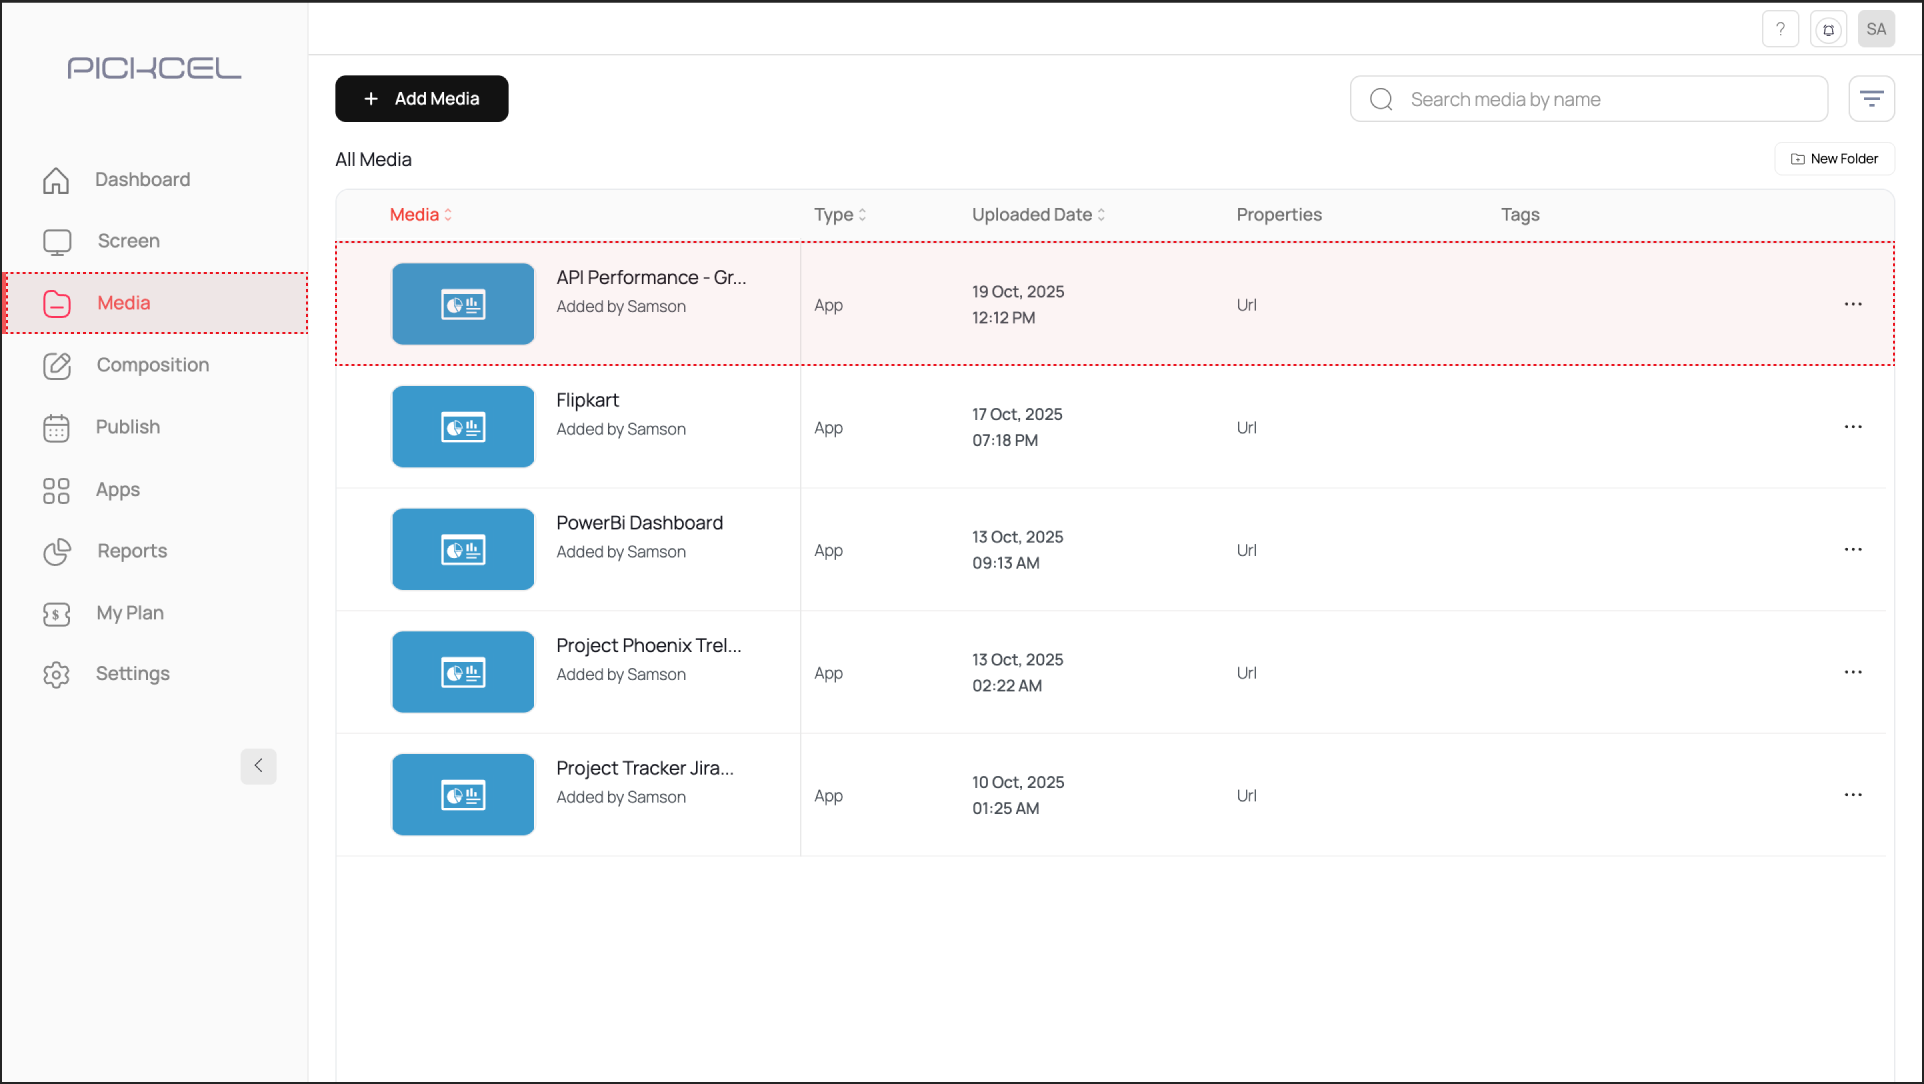
Create the Dashboard App in Pickcel
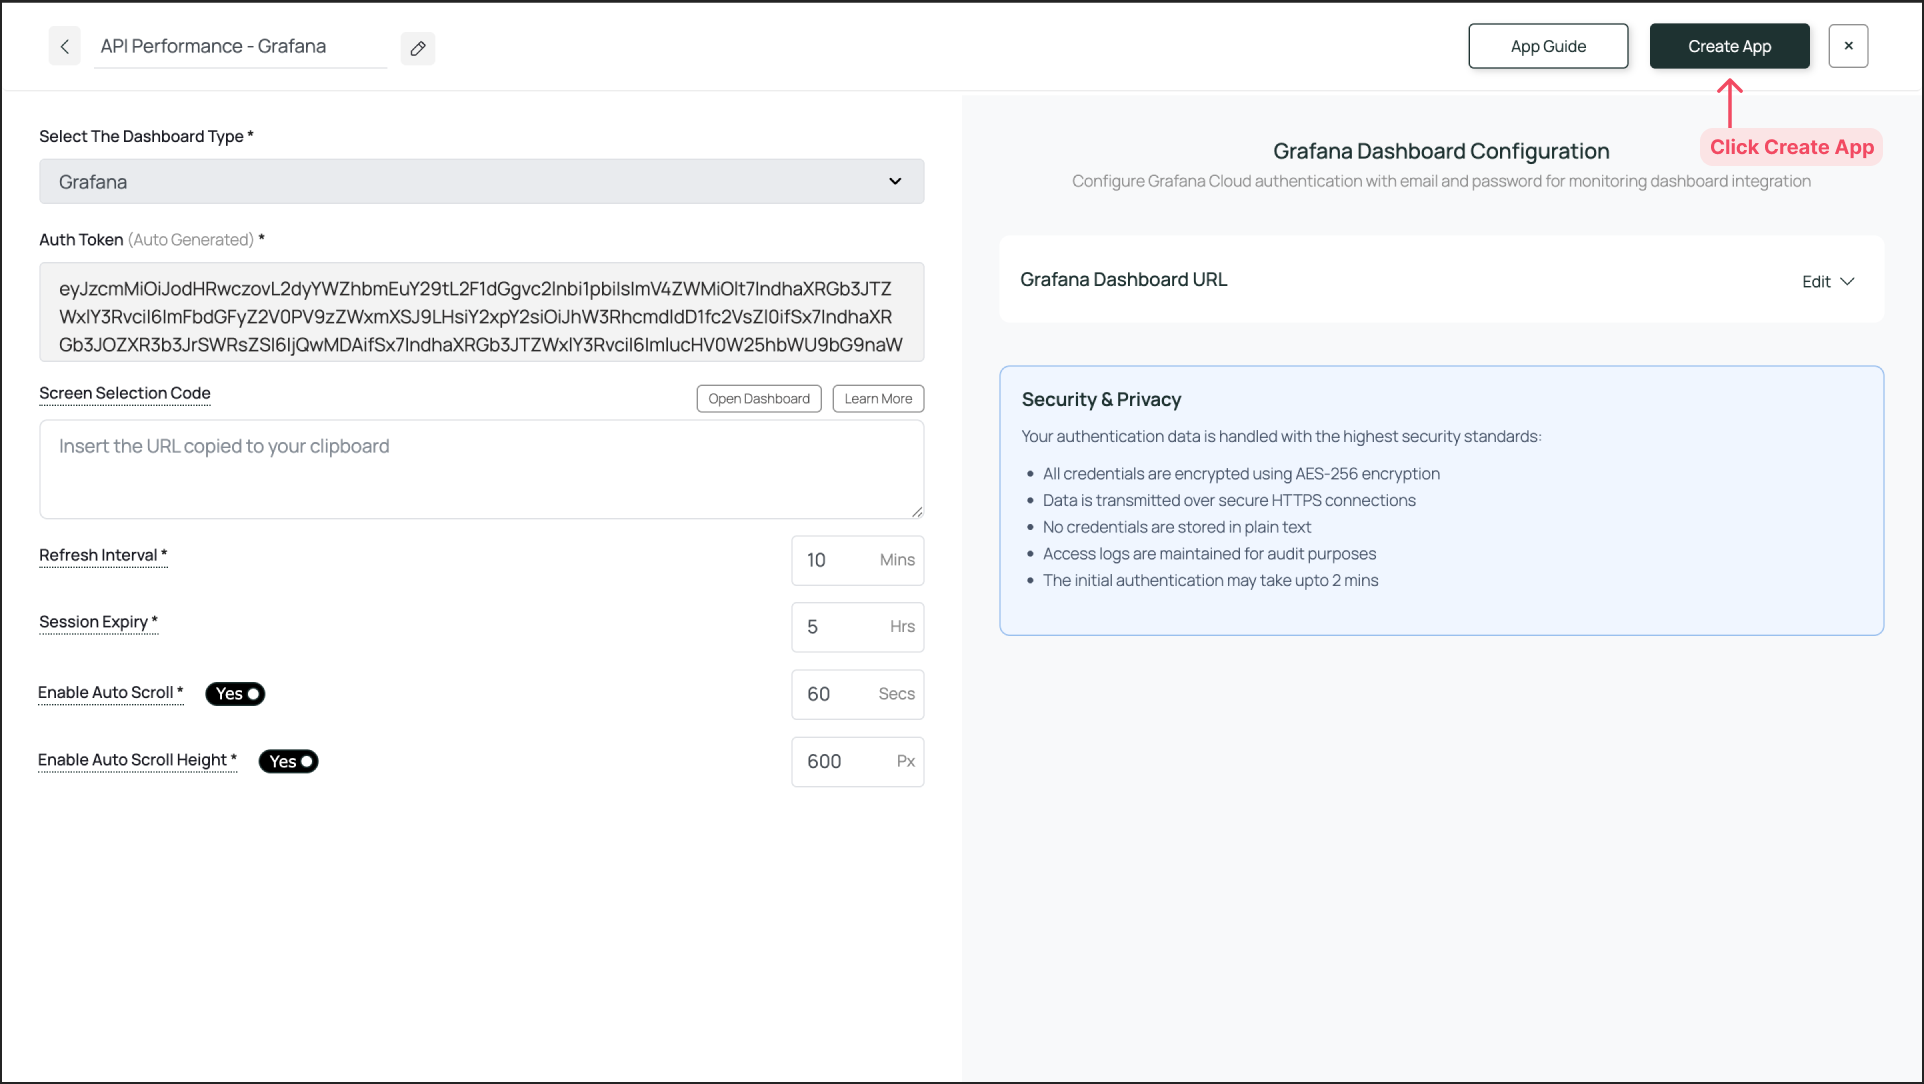
Log in to the Pickcel Console and navigate to Apps. Search for the Dashboard app and click on it. Then, click Create App.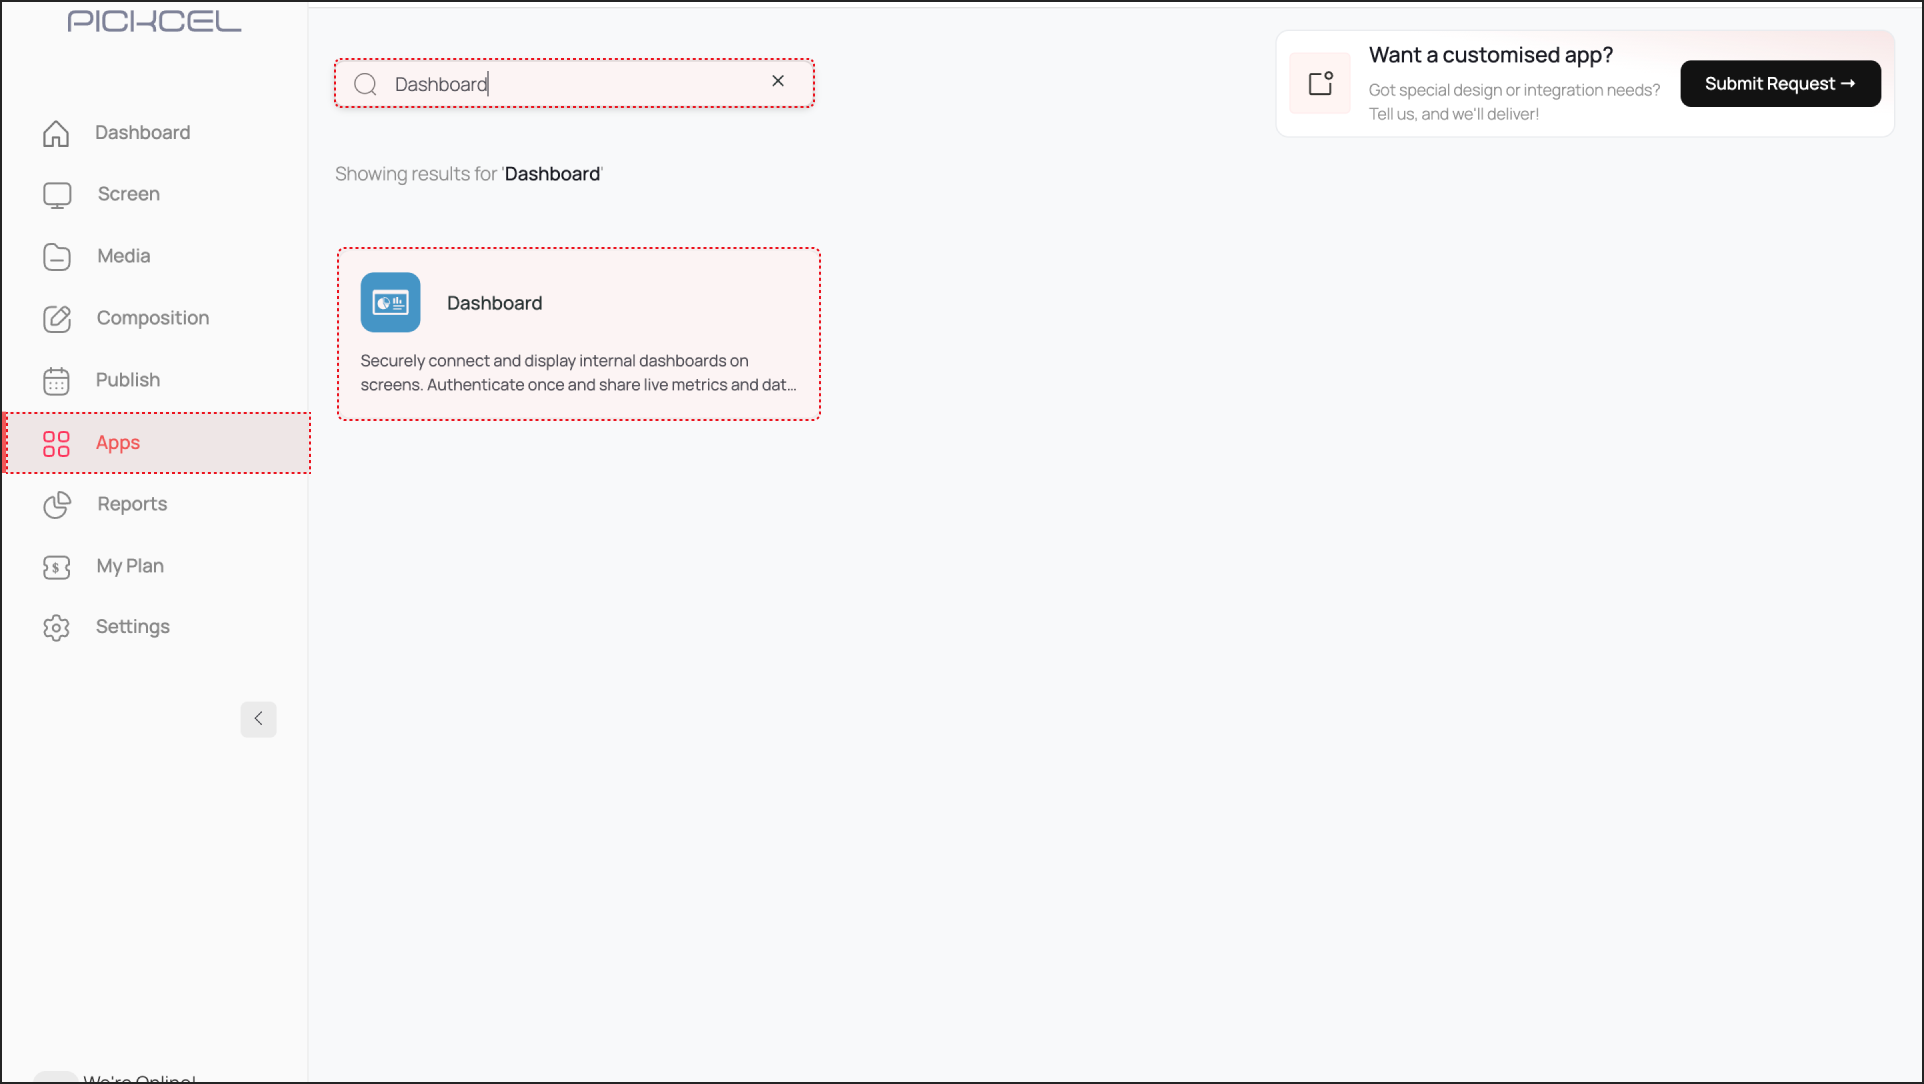
- Give a name to the app instance based on the dashboard you are configuring (e.g., “API Performance - Grafana”).
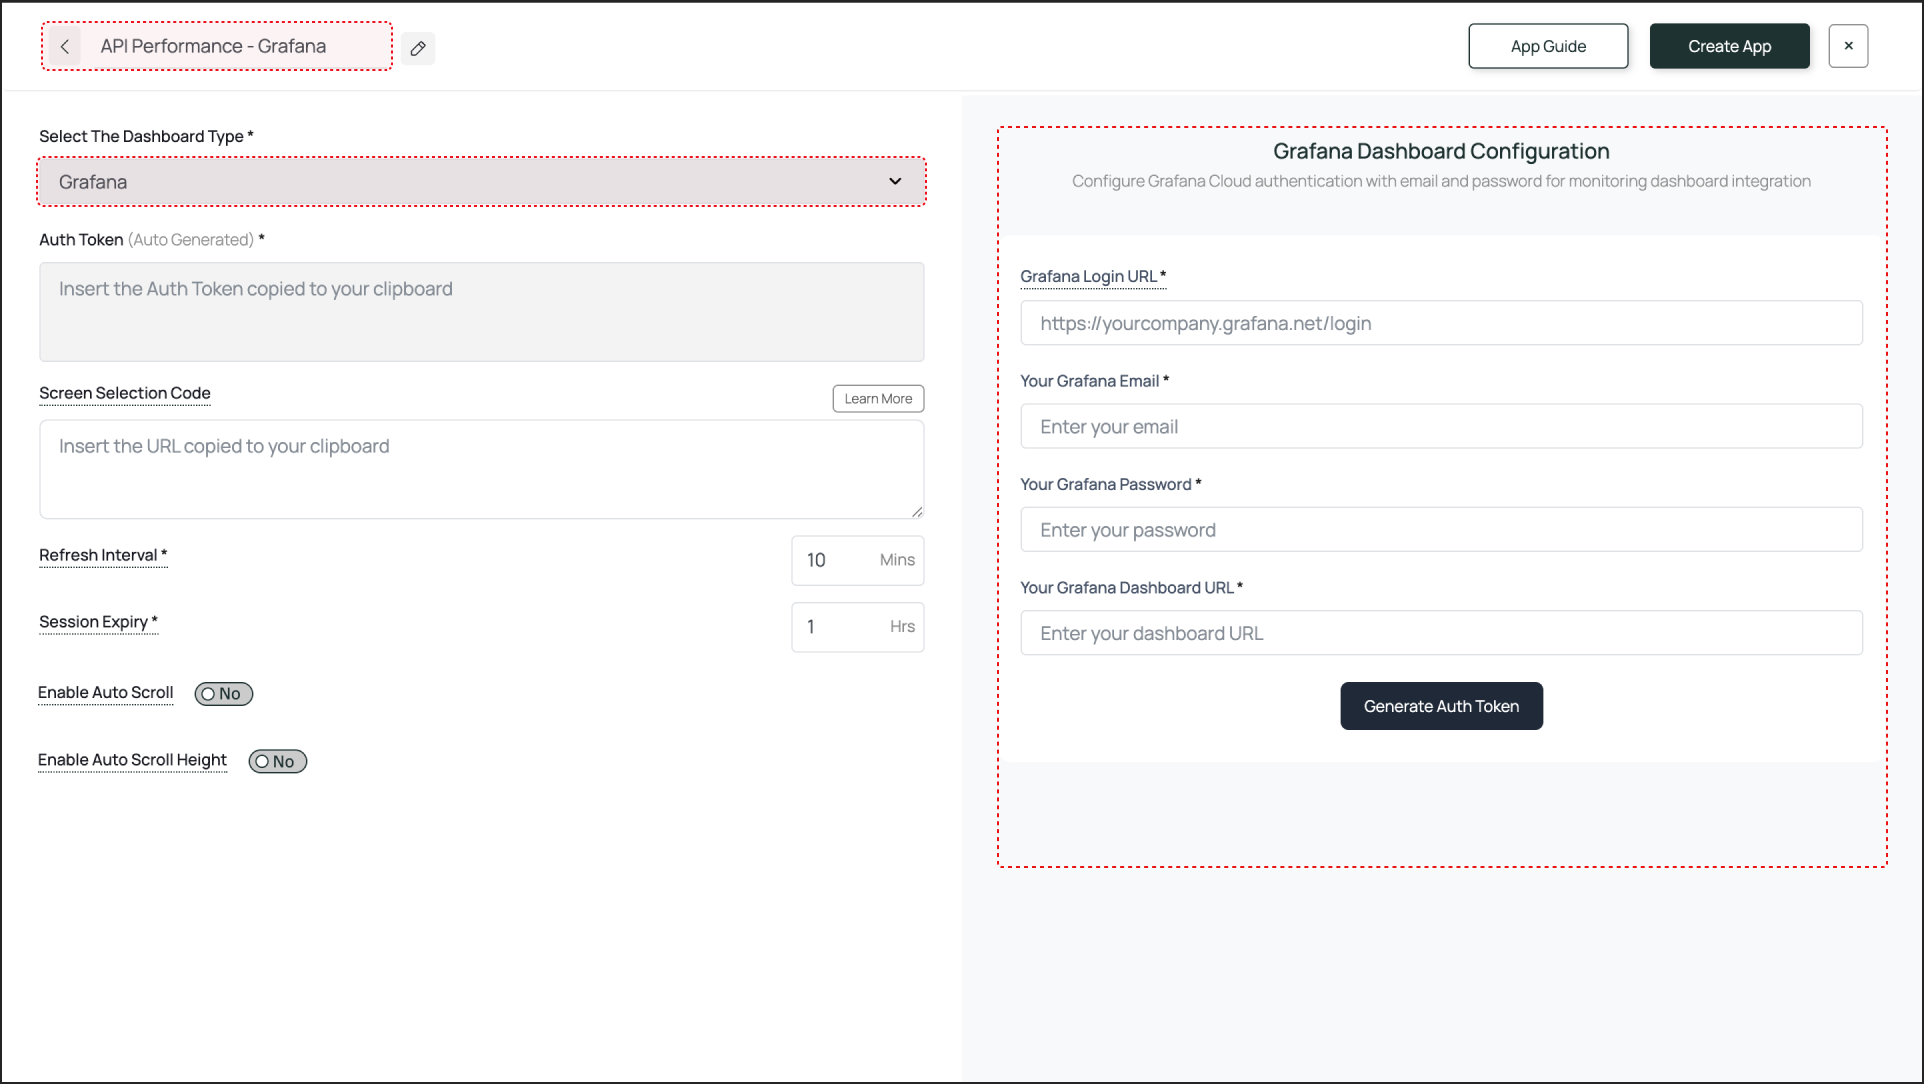
- Select Grafana from the dropdown menu. The fields required for configuring your Grafana Dashboard will open on the right-hand side.
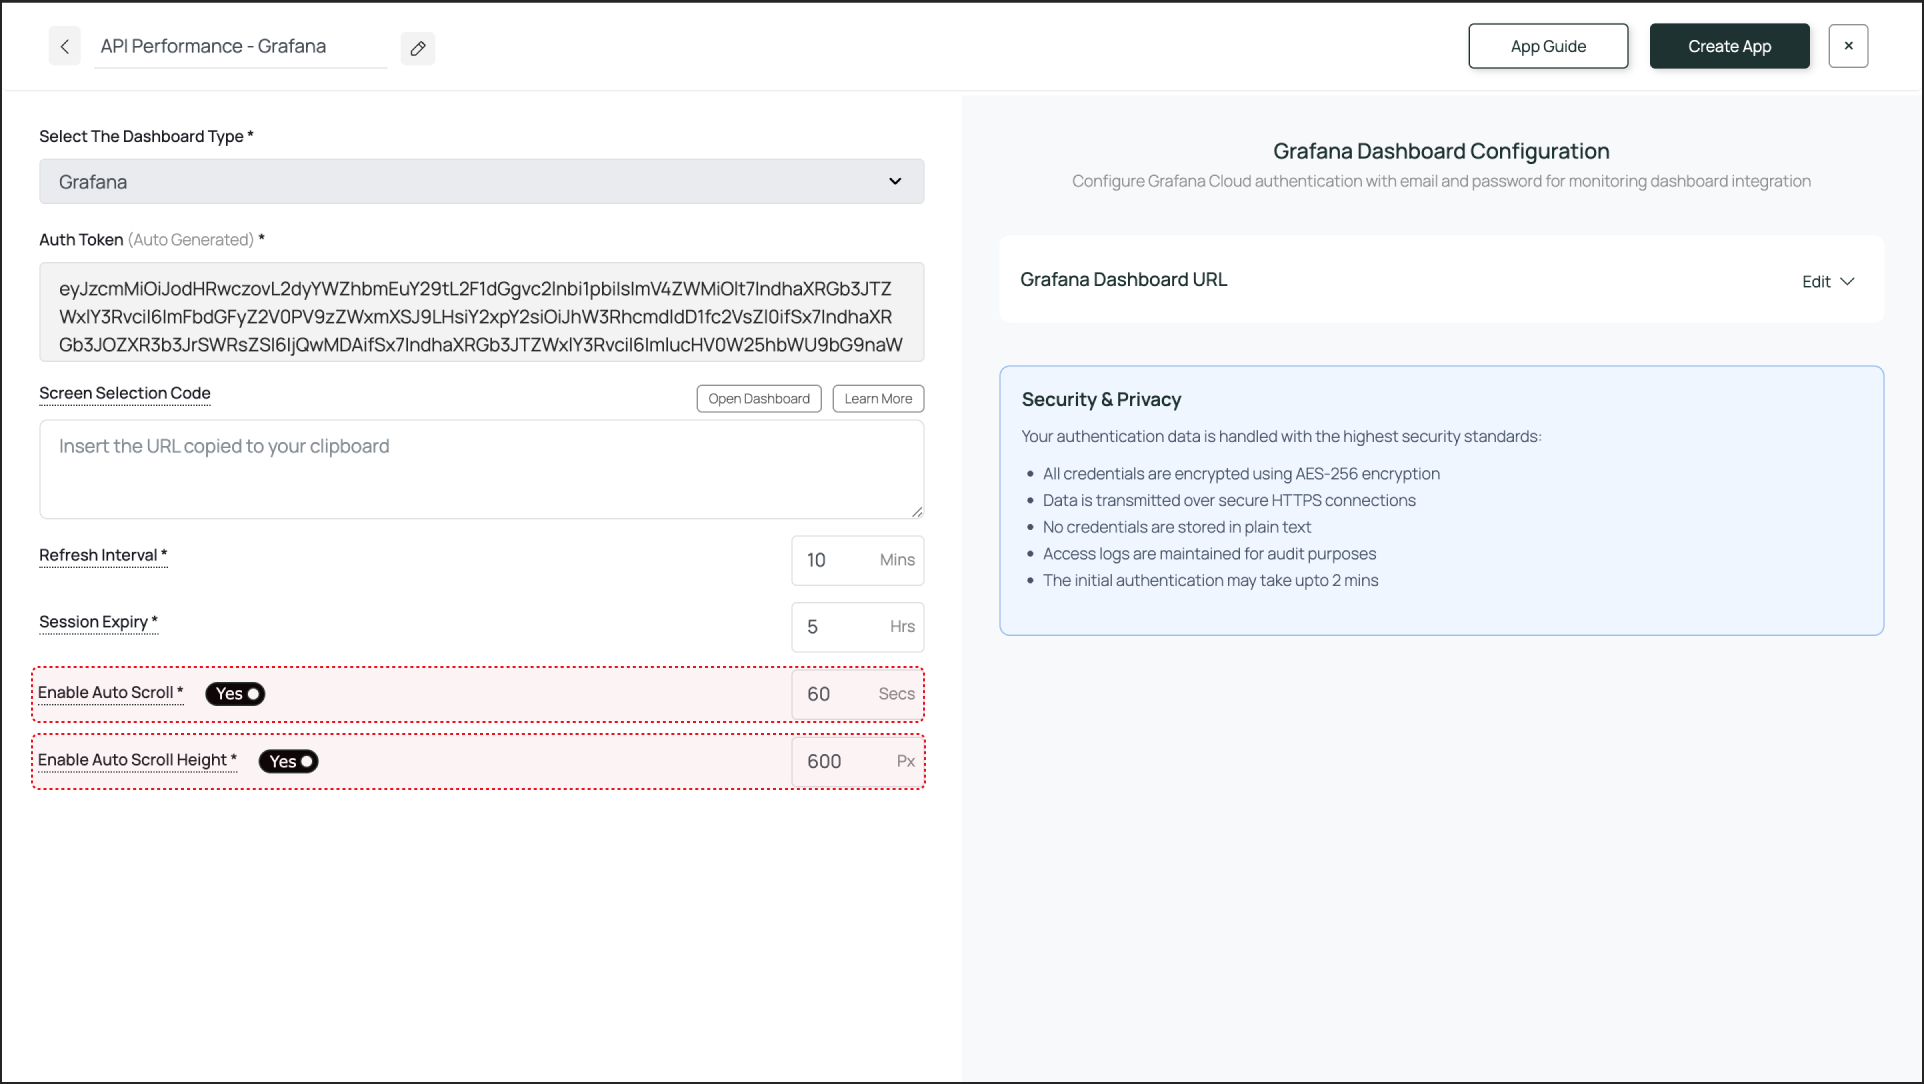
Fill in the Fields for Grafana Dashboard Configuration
This section requires precise information to generate a correct and secure Auth Token.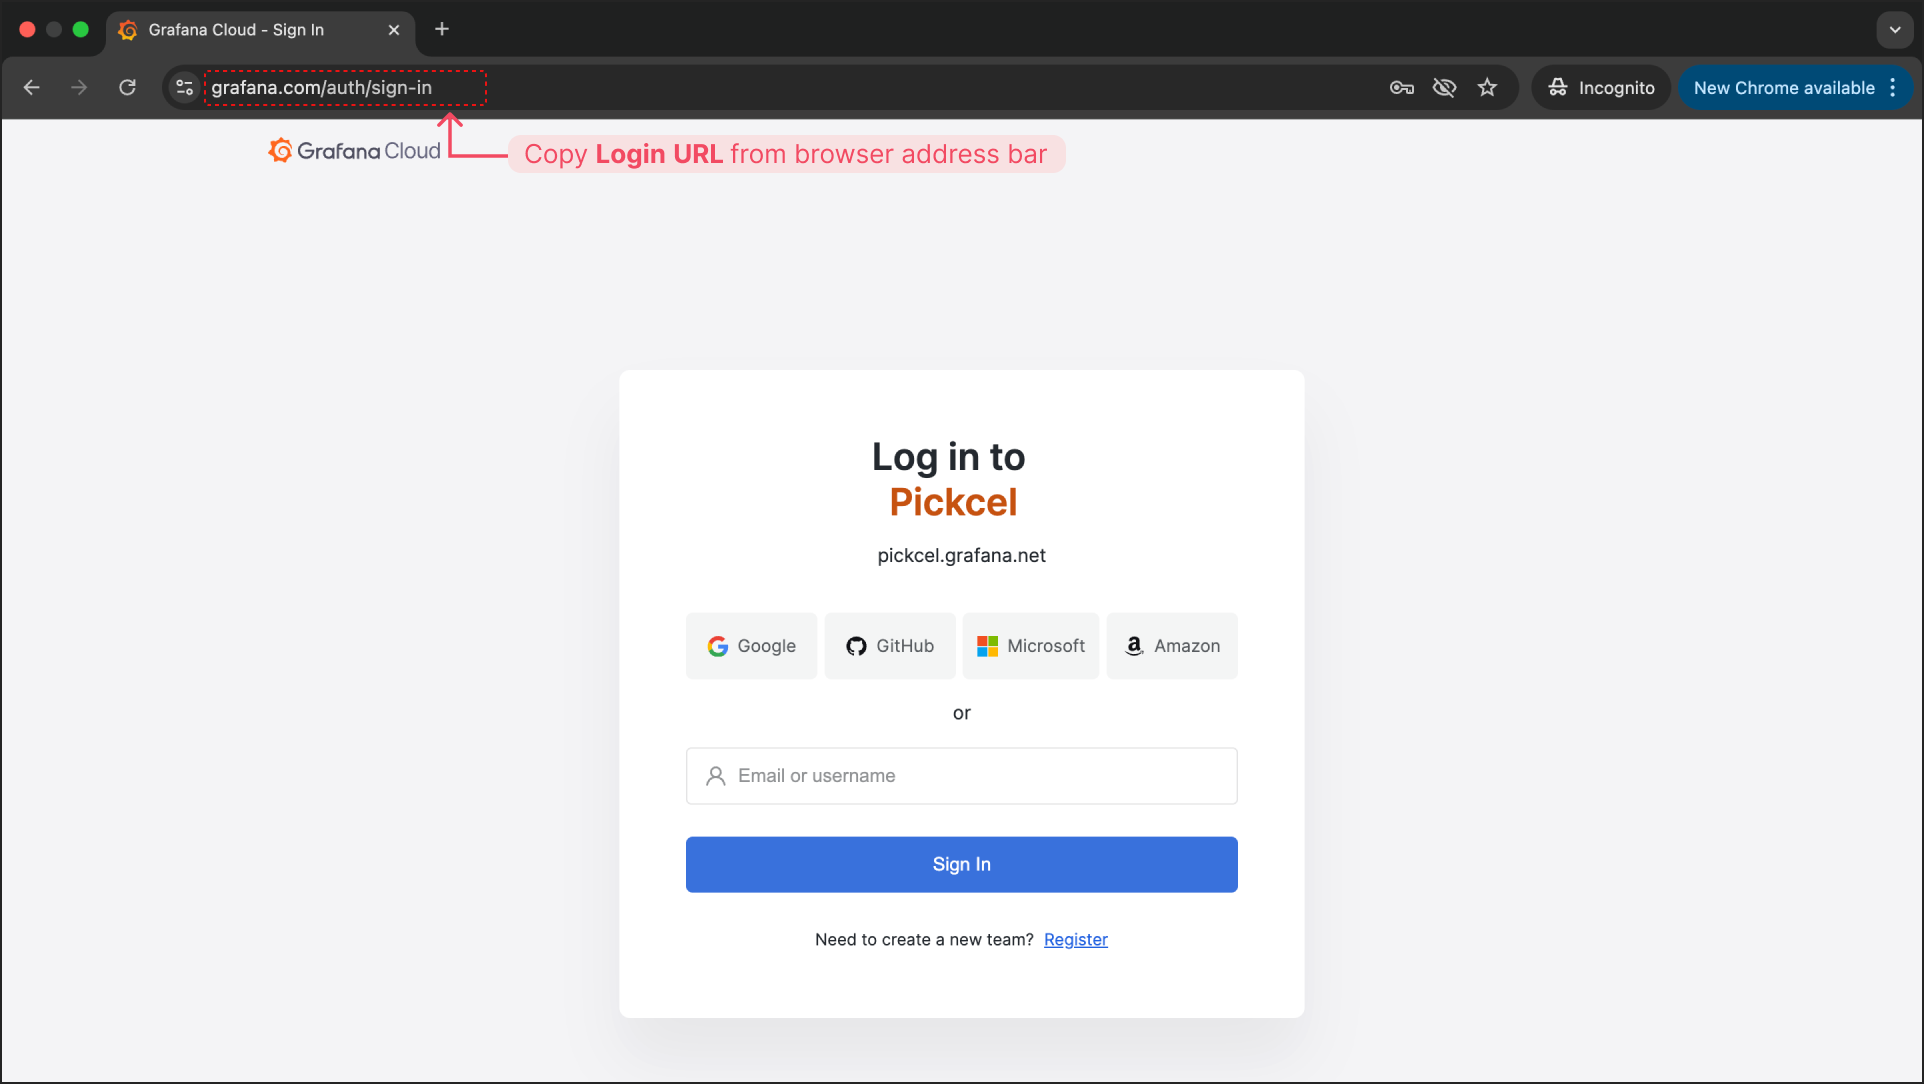
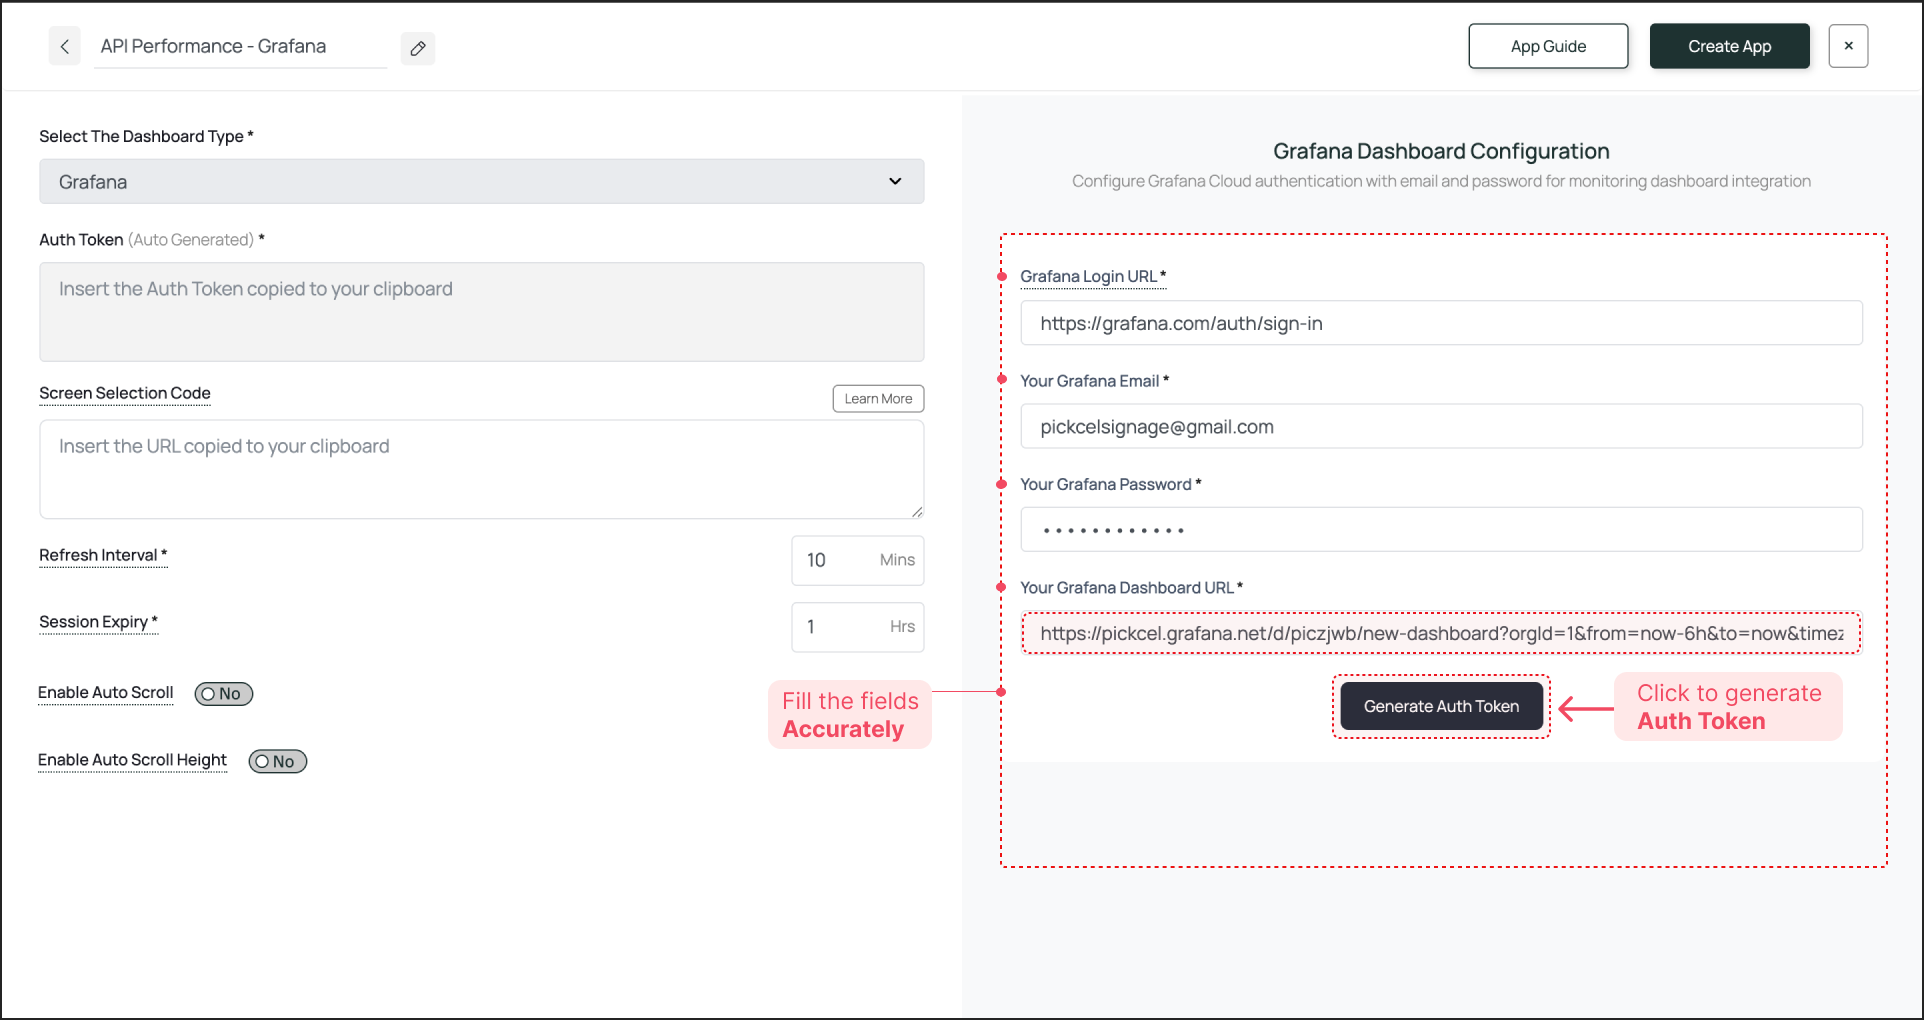 Click Generate Auth Token. The token will be generated and automatically pasted into the Auth Token field on the left.
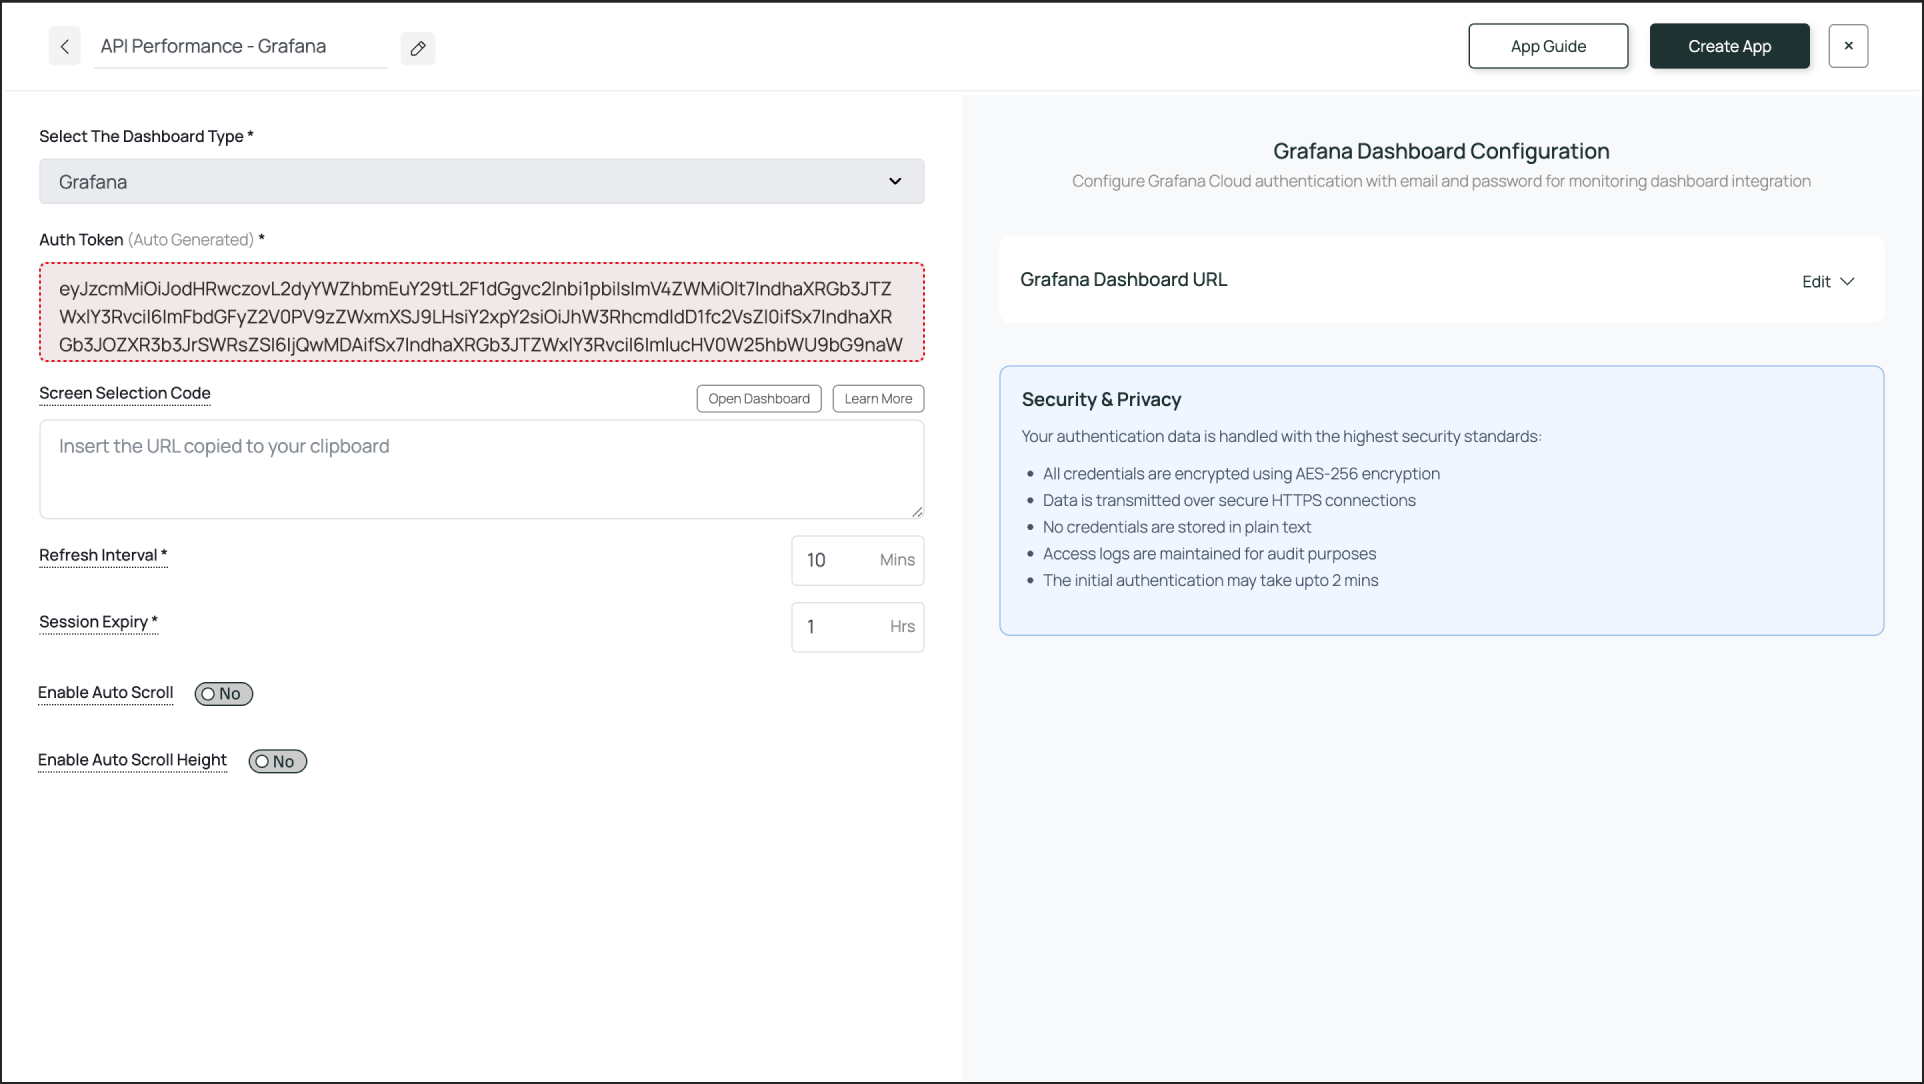
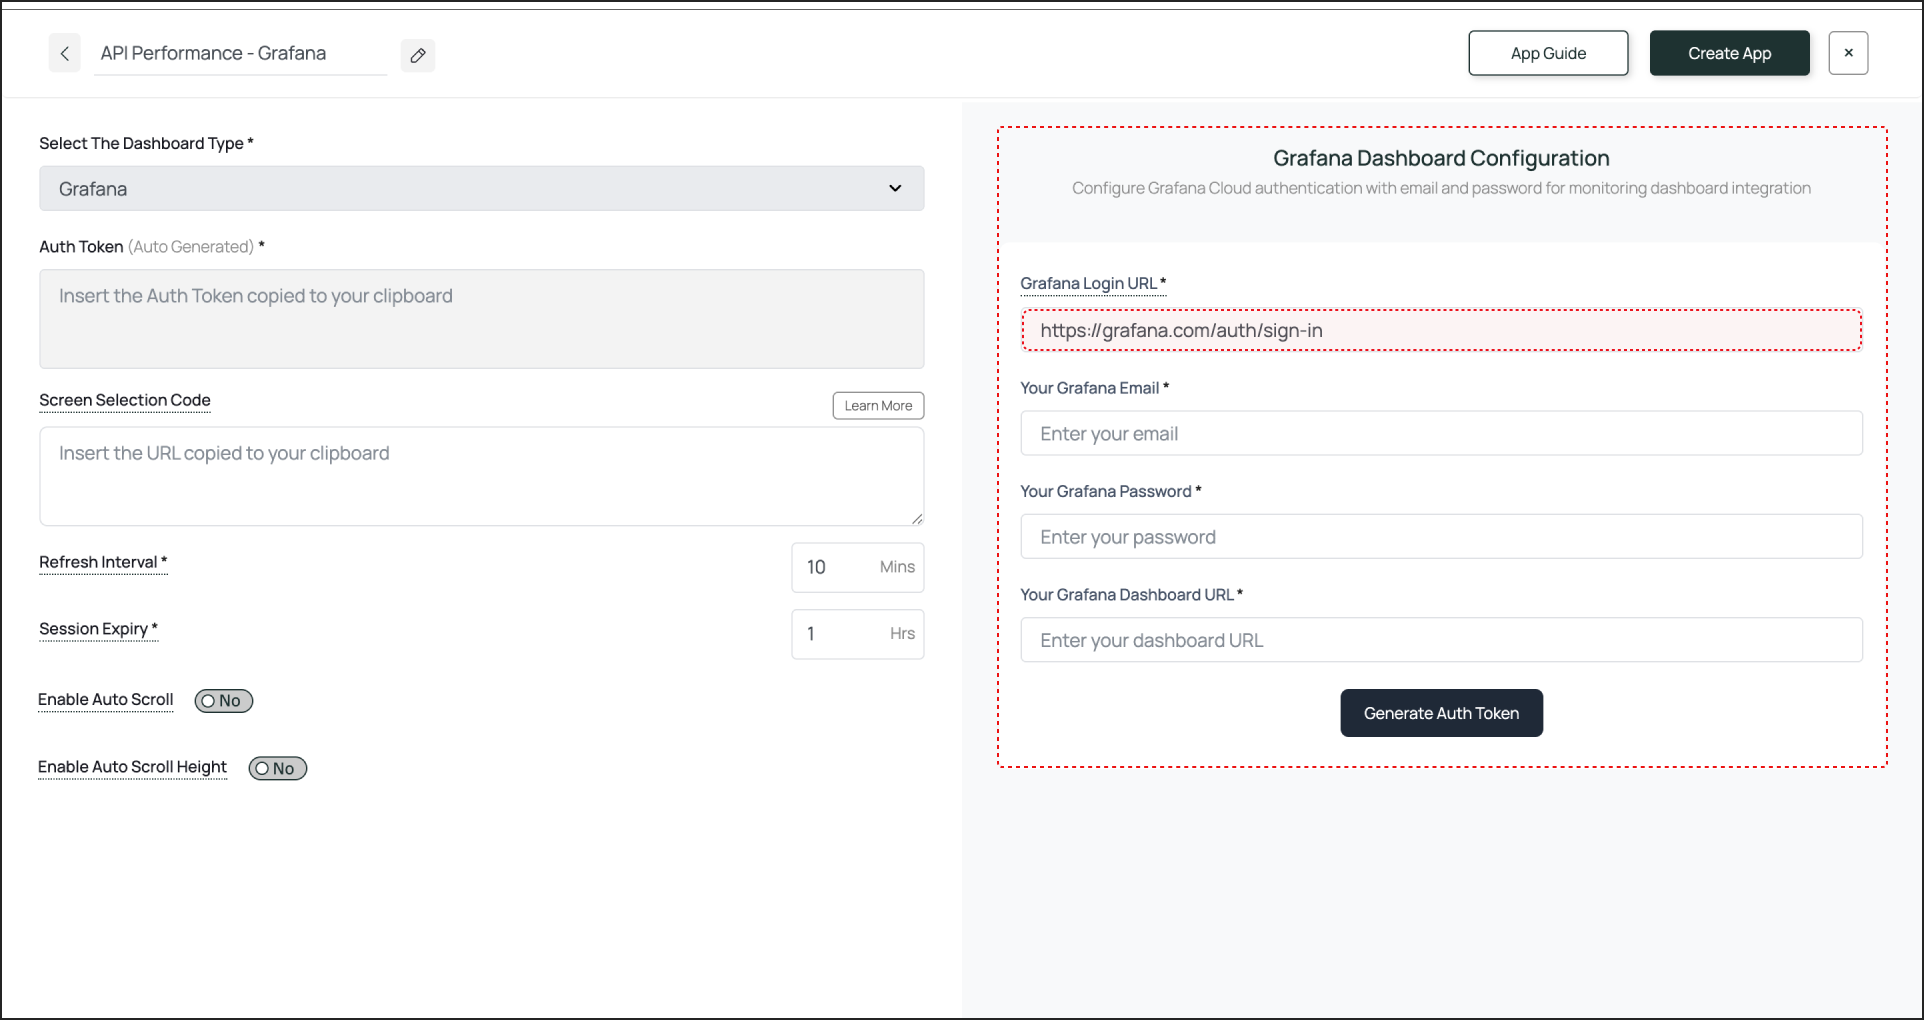
- Grafana Login URL: Go to your Grafana instance’s login page. Copy the entire URL from the browser’s address bar (e.g.,
https://yourcompany.grafana.net/login) and paste it here.
- Email: Enter the email address that you use for logging in to your Grafana account.
- Password: Enter the password for that account.
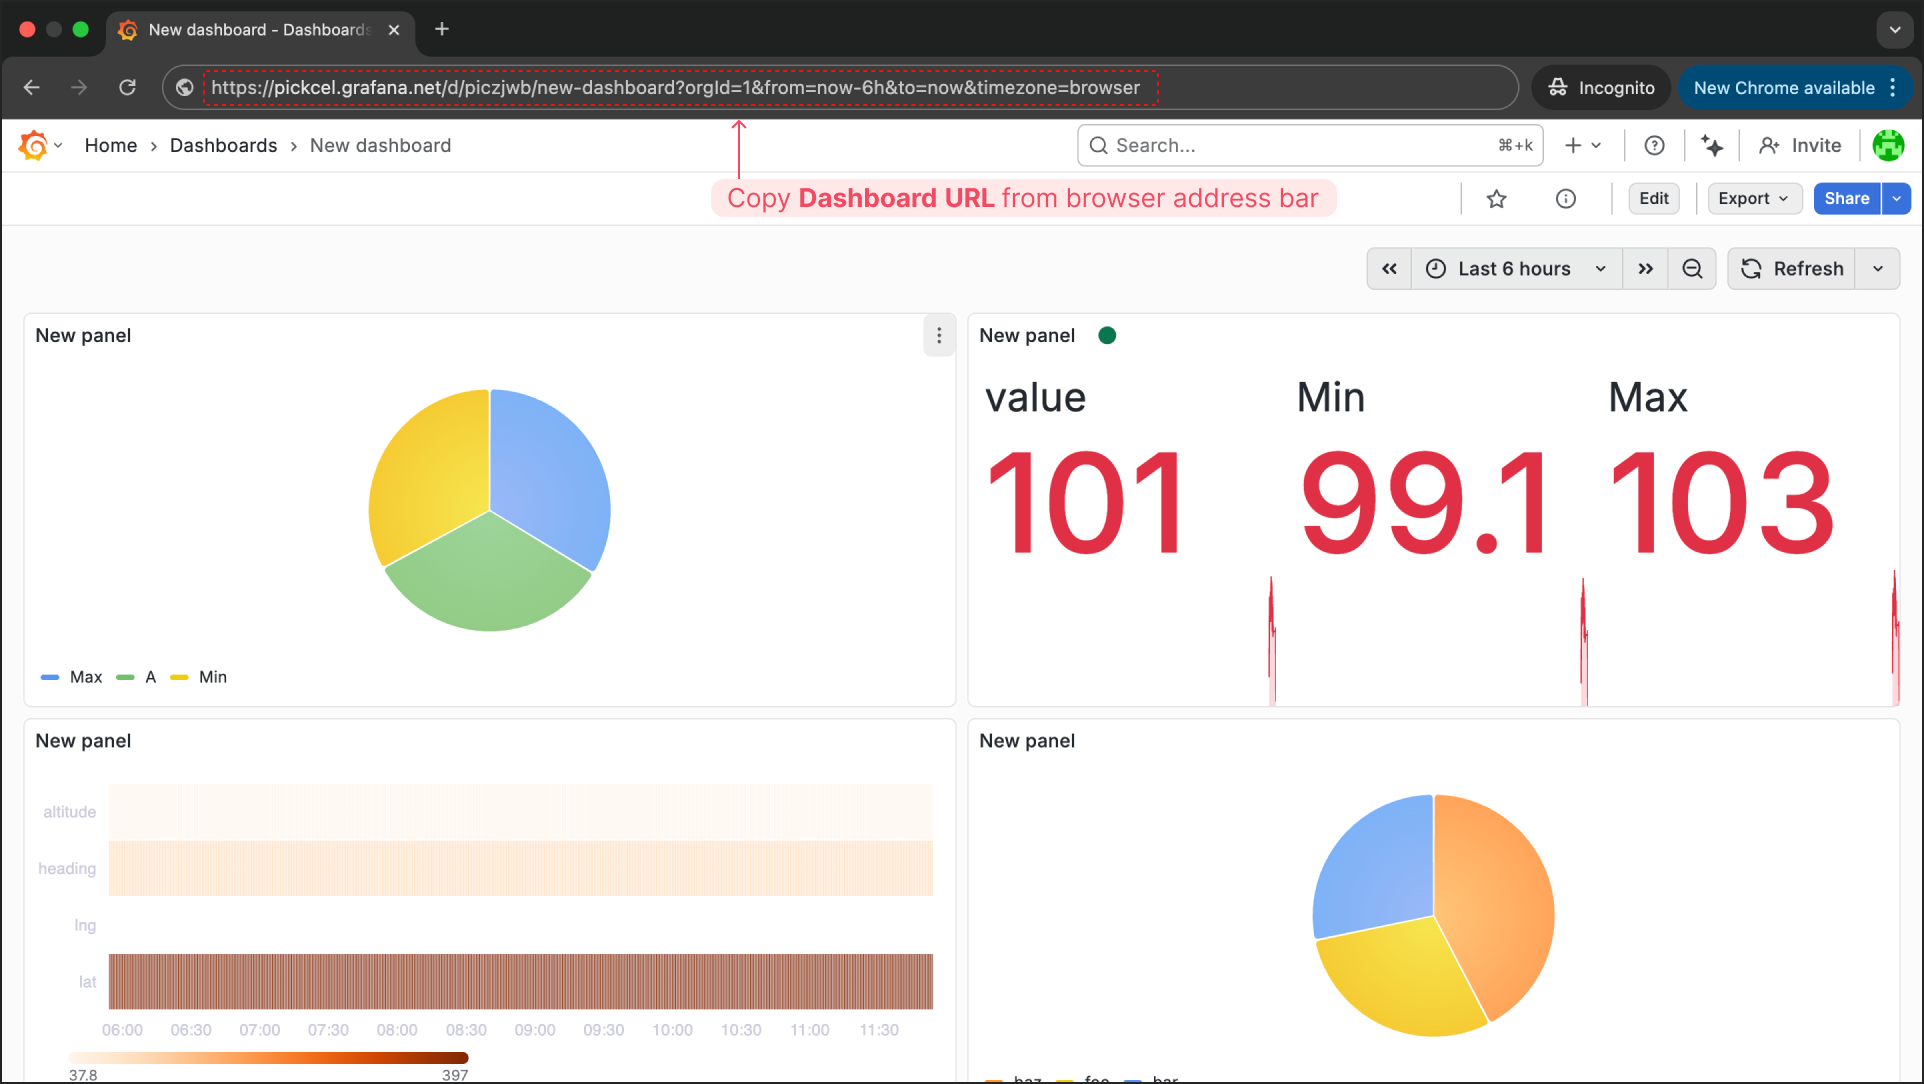
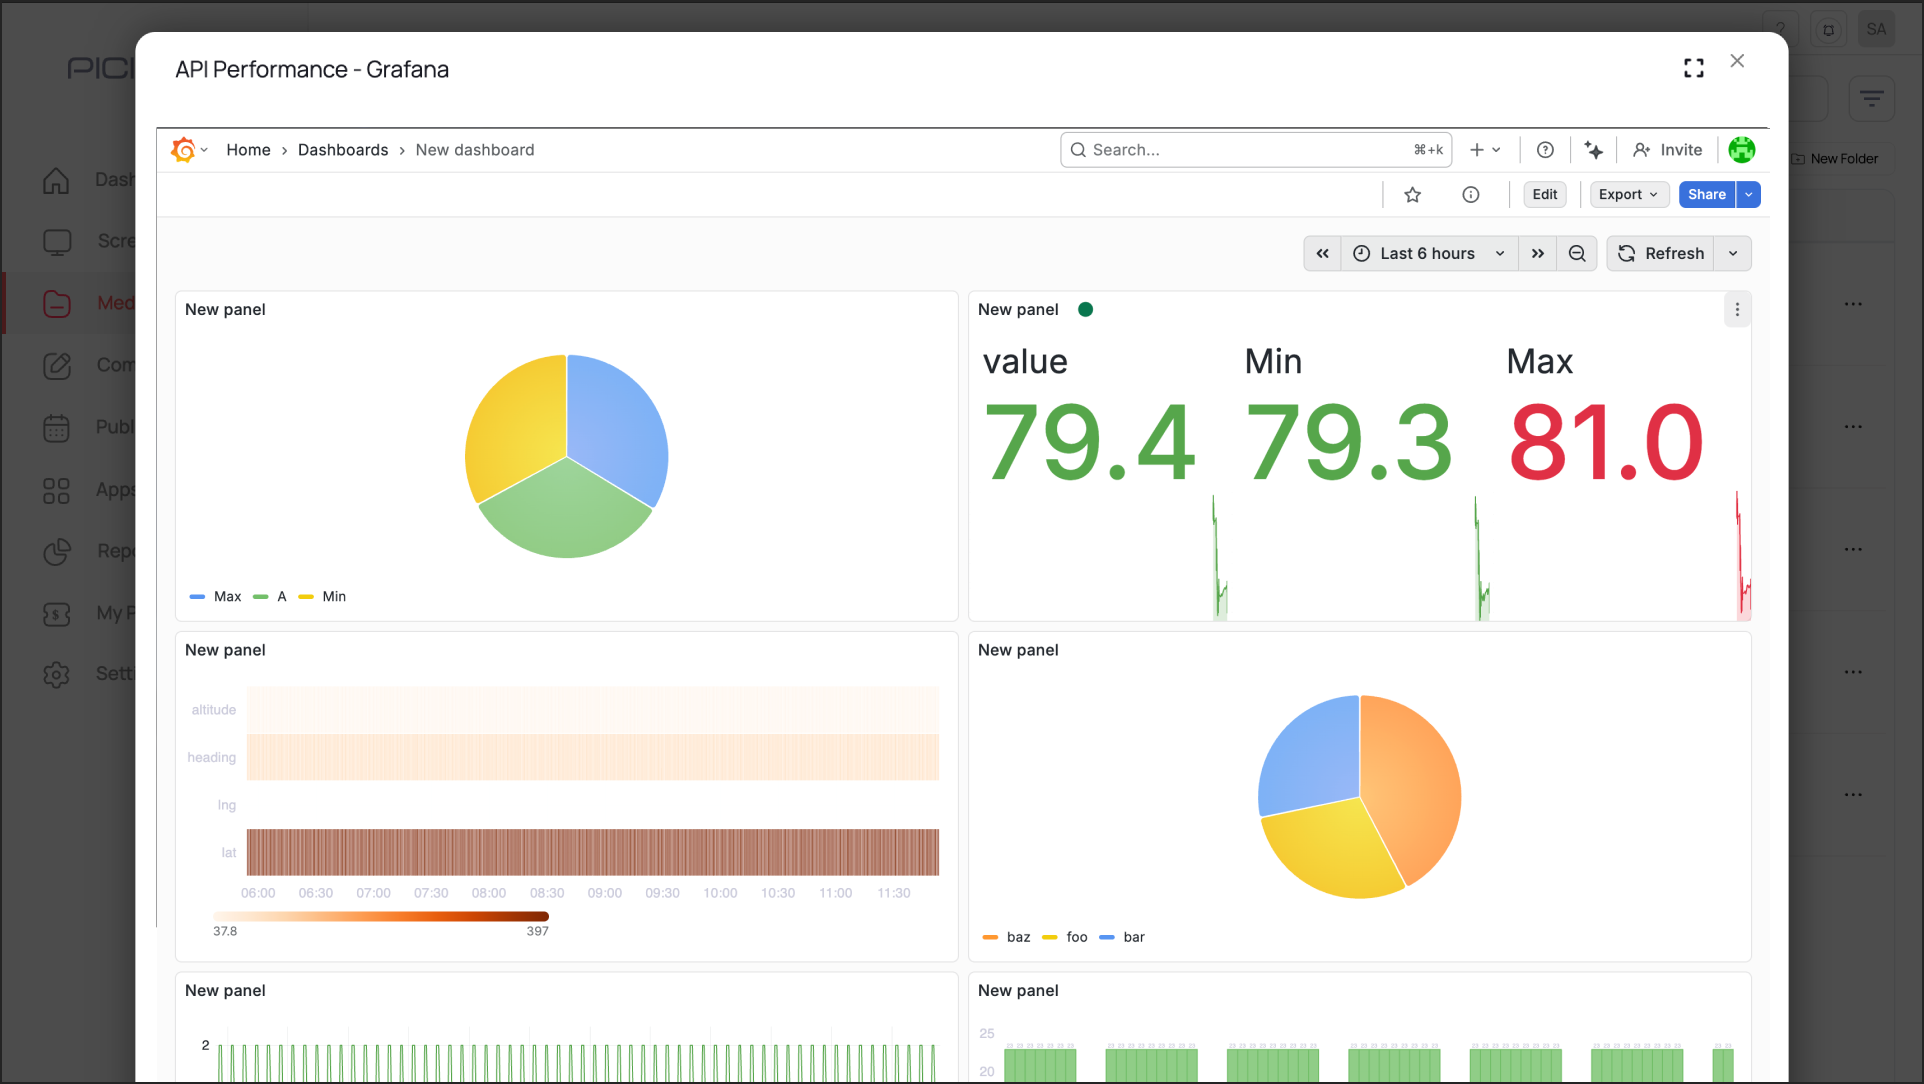
- Dashboard URL: Log in to Grafana and navigate to the exact dashboard you want to display. Copy the entire URL from the address bar and paste it here.
Enter Screen Selection Code (Optional)
If you want to display only a specific portion of the dashboard (like a specific set of panels), use the Pickcel Dashboard Screen Mapper Extension. Select the area you want to display, and upon confirming the selection, the code will be copied to your clipboard. Paste this code into the Screen Selection Code field.Check this guide for more info: How to Use the Dashboard Screen Mapper Chrome Extension?
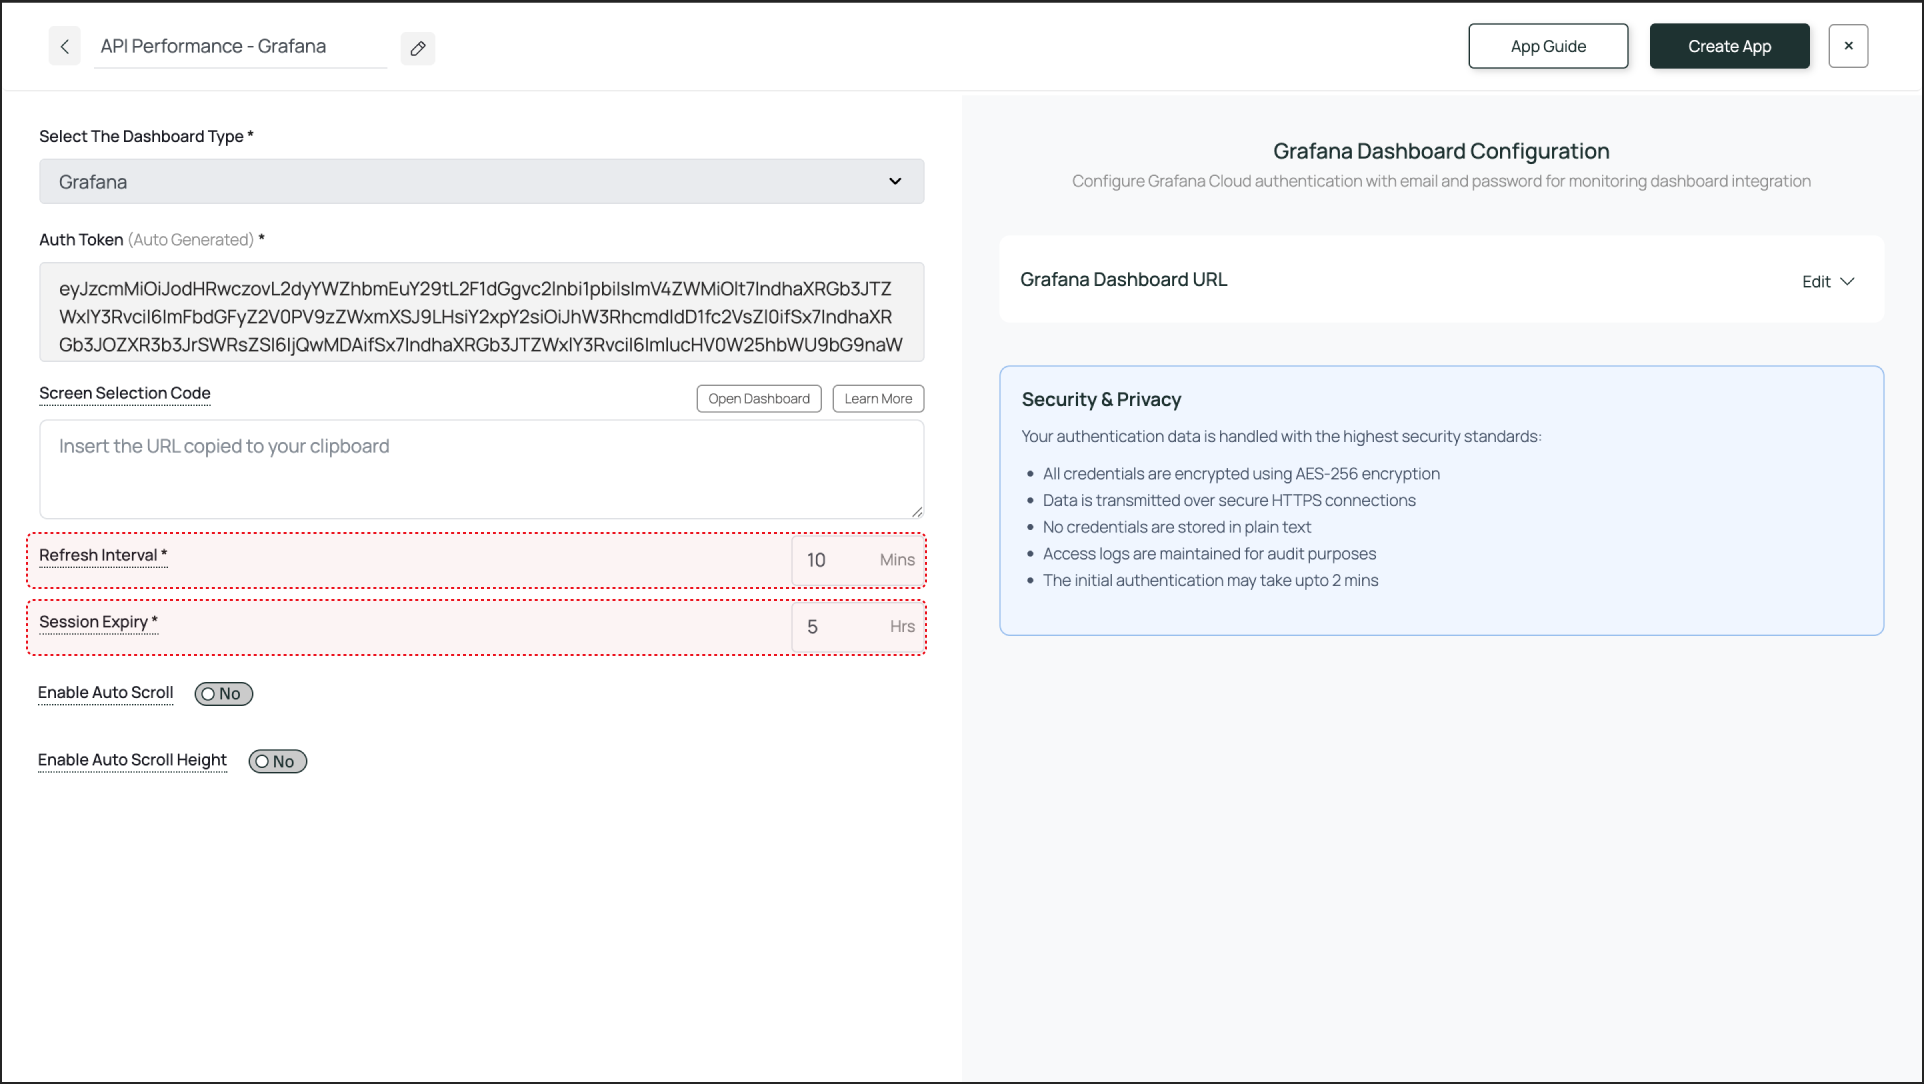
Set Refresh Interval and Session Expiry
- Refresh Interval: This setting defines how often the dashboard screenshot is updated. For real-time operational metrics, a short refresh interval of 5-10 minutes is recommended.
- Session Expiry: This forces a fresh login to prevent session timeouts. A value of 5-8 hours is recommended for continuous display during a workday.
Enable Scroll Option for the Dashboard (Optional)
- Enable Auto Scroll: Set a scroll duration in seconds. For example, at 60 seconds, the entire dashboard scrolls from top to bottom over 60 seconds.
- Enable Auto Scroll Height: Set a scroll height in pixels. The screen scrolls down by the defined pixel height.
What’s Next?
Your Grafana Dashboard App is now ready. For further reading:
- To create a multi-zone layout: Learn about Compositions
- To send it to your screens: Learn how to Publish or Schedule Content