

Prerequisites
Before you begin, make sure you have:- A Microsoft account with access to the target Power BI report
- The full report URL copied from your browser
- 2-Factor Authentication (2FA) enabled on the account, with the secret key saved
See our guide: How to Set Up 2FA and Get a Secret Key
Step-by-Step Configuration
1
Navigate to Apps and search for the Dashboard app
In the Pickcel Console, expand Content in the left menu and select Apps. Search for Dashboard and click the Dashboard app card.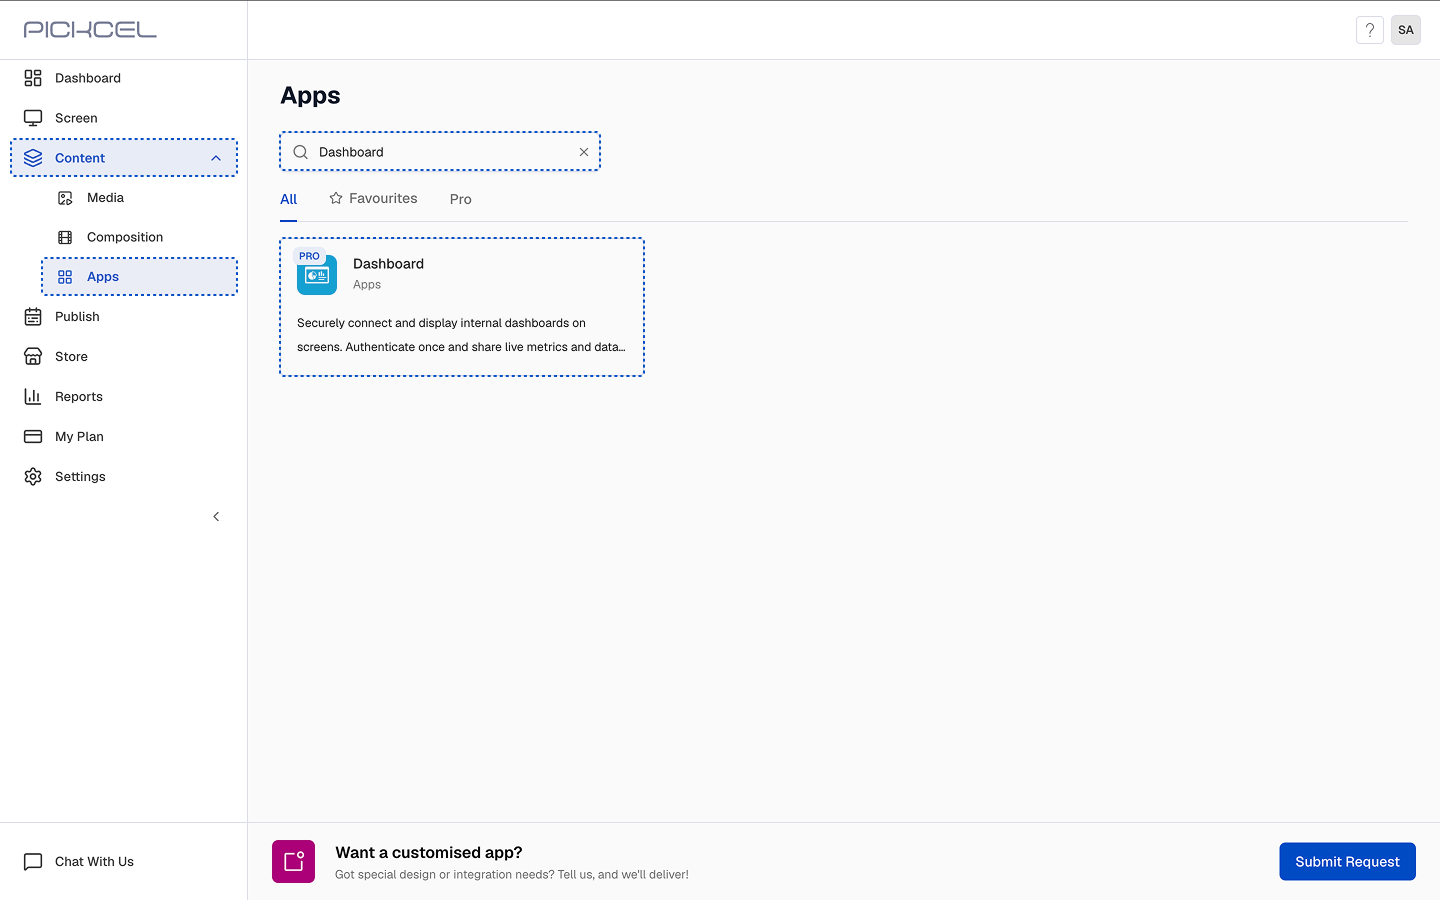
2
Create the app and select Power Bi as the dashboard type
Click Create App in the top-right corner. Enter a name for this app instance, then select Power Bi from the Select the Dashboard Type dropdown. The Power Bi Dashboard Configuration panel opens on the right side of the screen.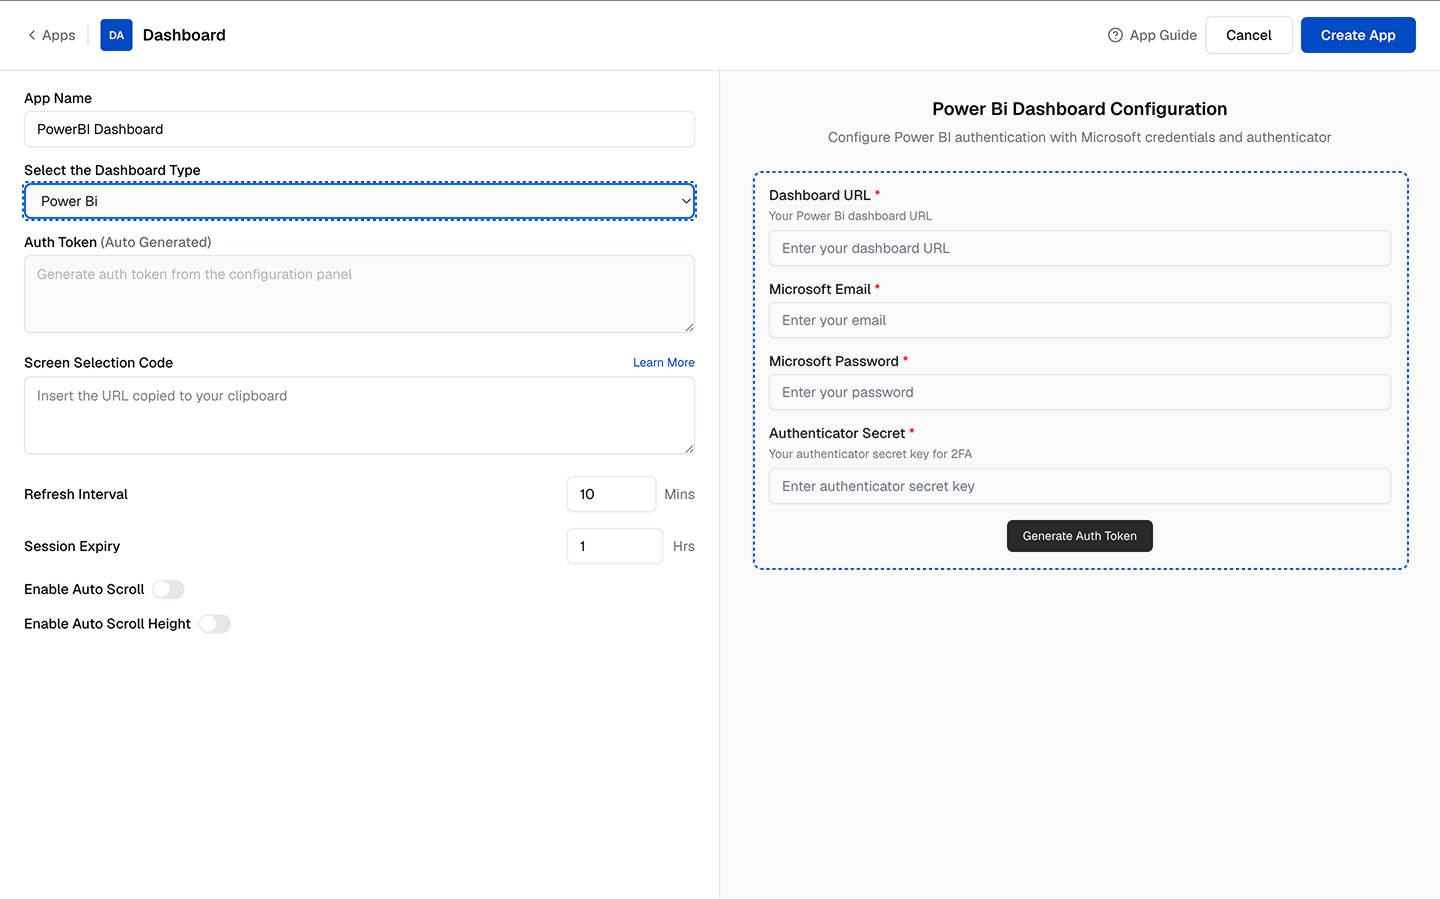
3
Enter your Power BI Dashboard URL
In the Dashboard URL field on the right panel, paste the full URL of the Power BI report you want to display. Copy it directly from your browser’s address bar while viewing the report in Power BI.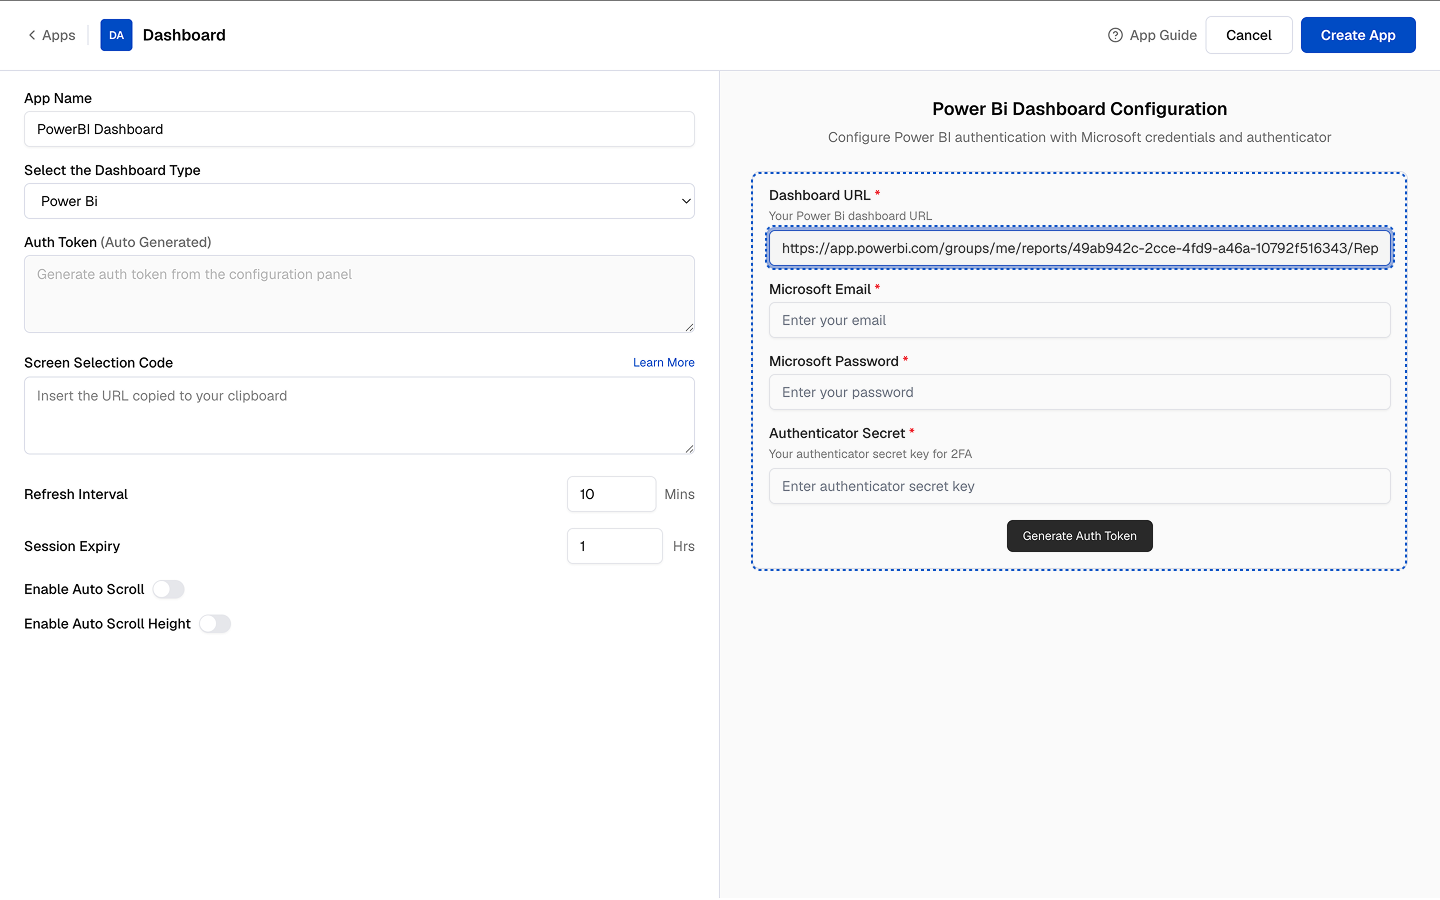
4
Fill in your Microsoft credentials and generate the Auth Token
Complete the remaining fields in the configuration panel: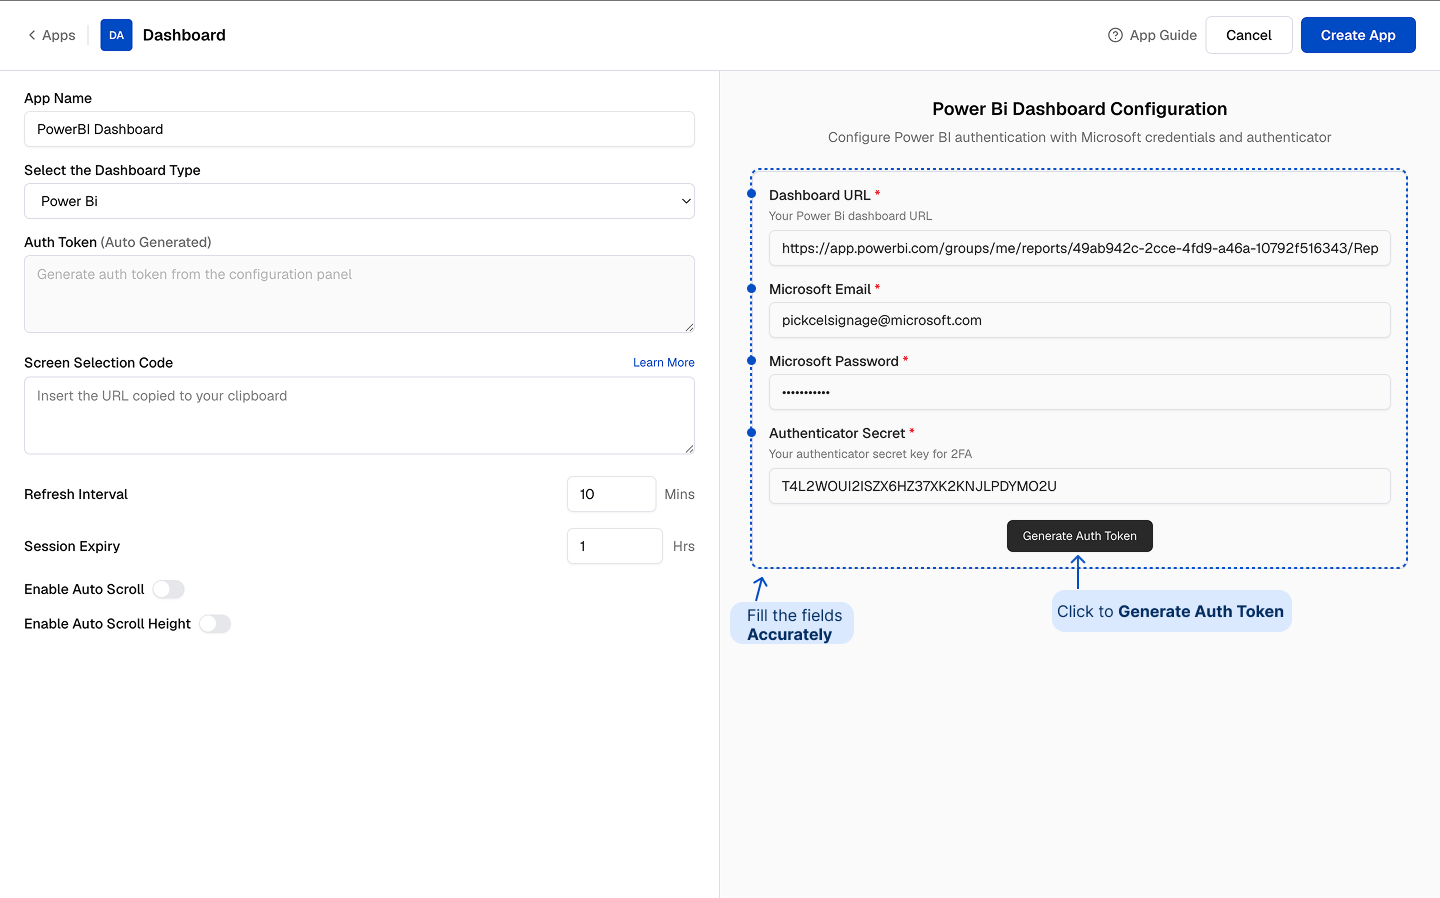
- Microsoft Email: The email address for your Microsoft account.
- Microsoft Password: The password for that account.
- Authenticator Secret: The 2FA secret key you saved when setting up 2FA.
5
Enter the Screen Selection Code
After the Auth Token is generated, use the Pickcel Dashboard Screen Mapper Chrome extension to select the exact area of the dashboard you want to show on screen. Once you confirm the selection, the code is copied to your clipboard. Paste it into the Screen Selection Code field.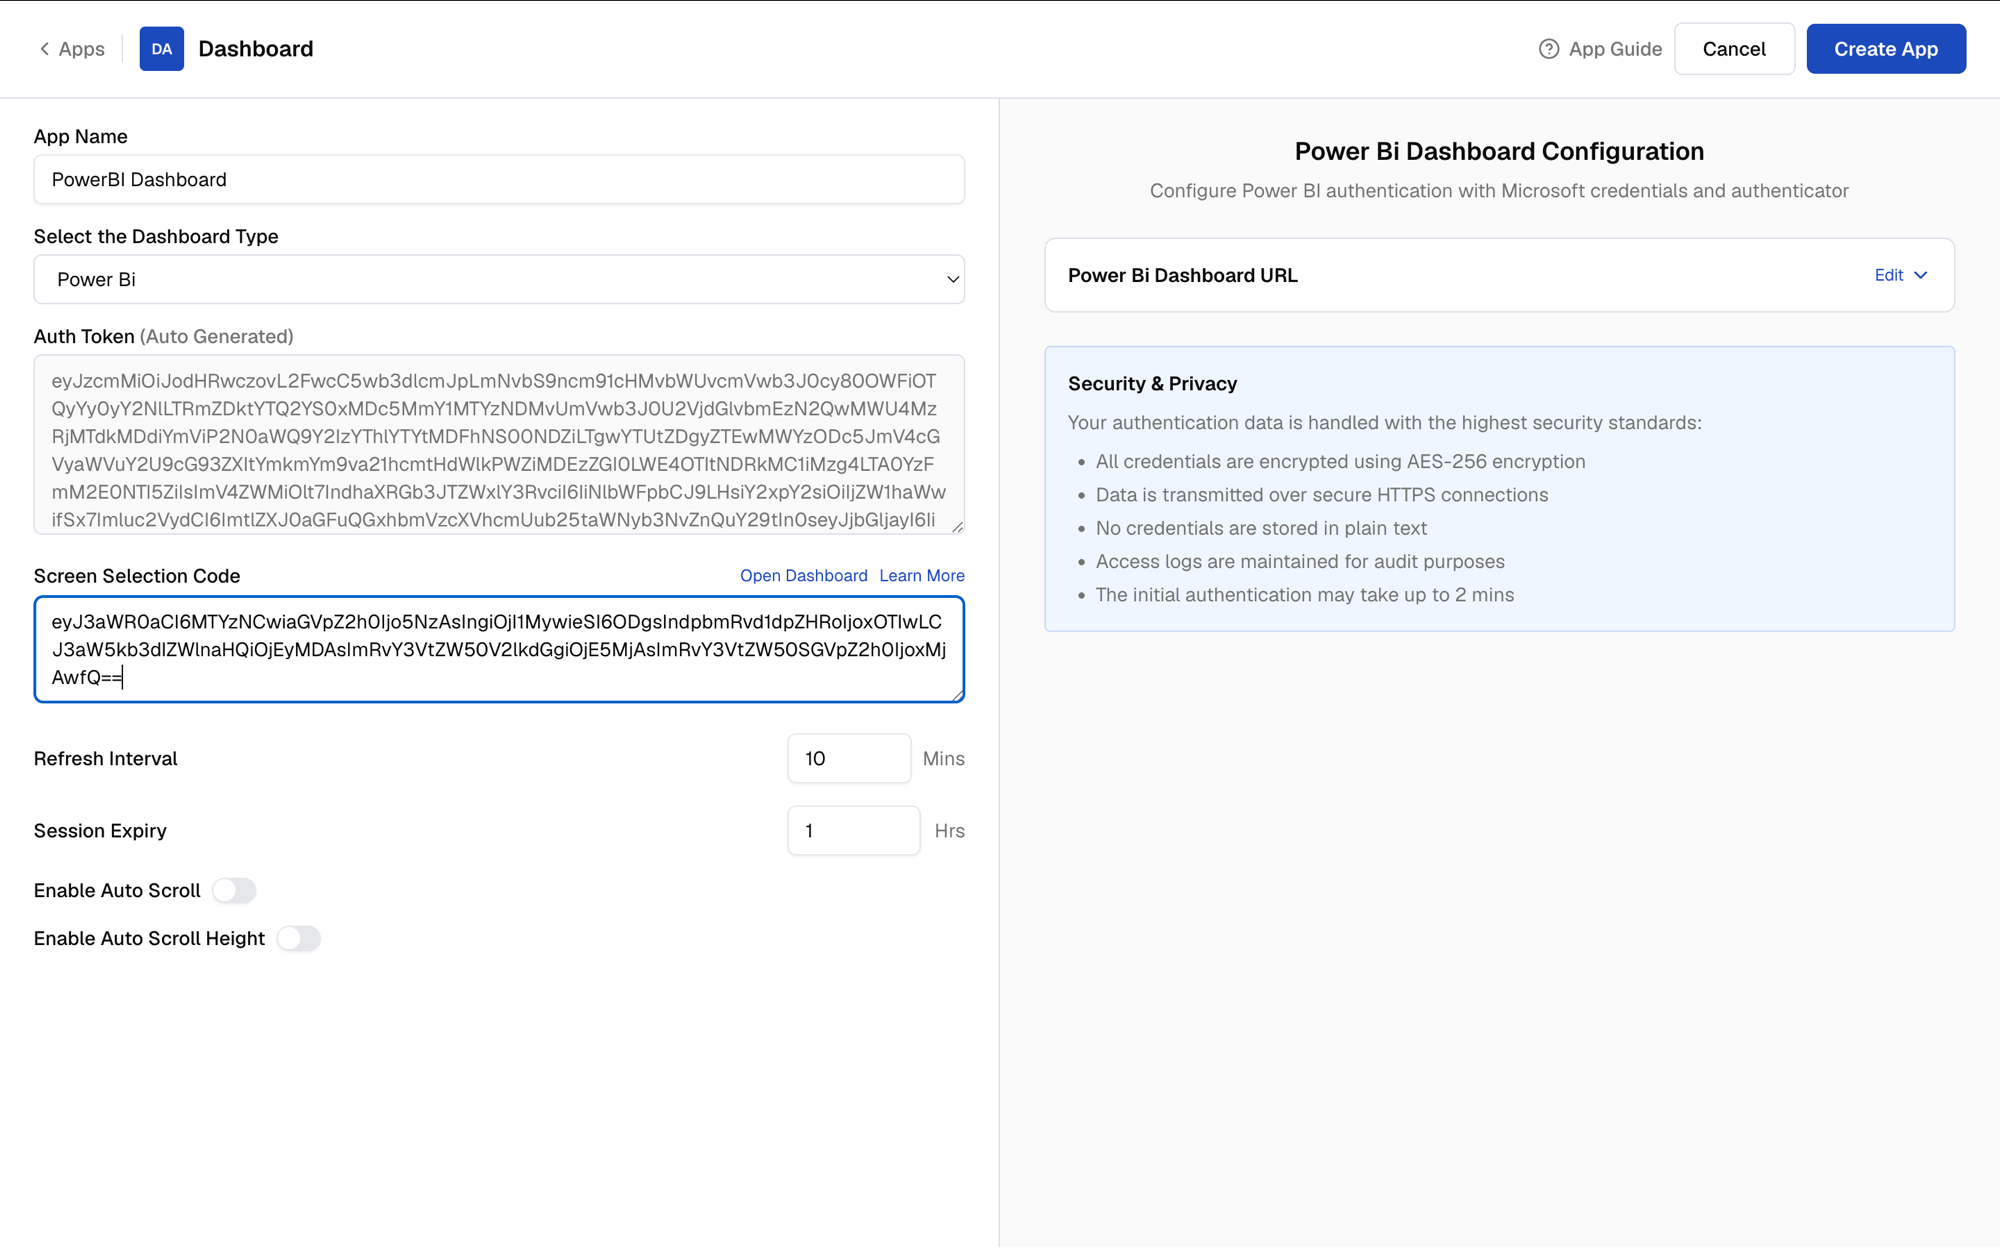 Click Open Dashboard next to the Screen Selection Code field to verify the dashboard loads correctly before saving.
For a detailed walkthrough: How to Use the Dashboard Screen Mapper Chrome Extension
6
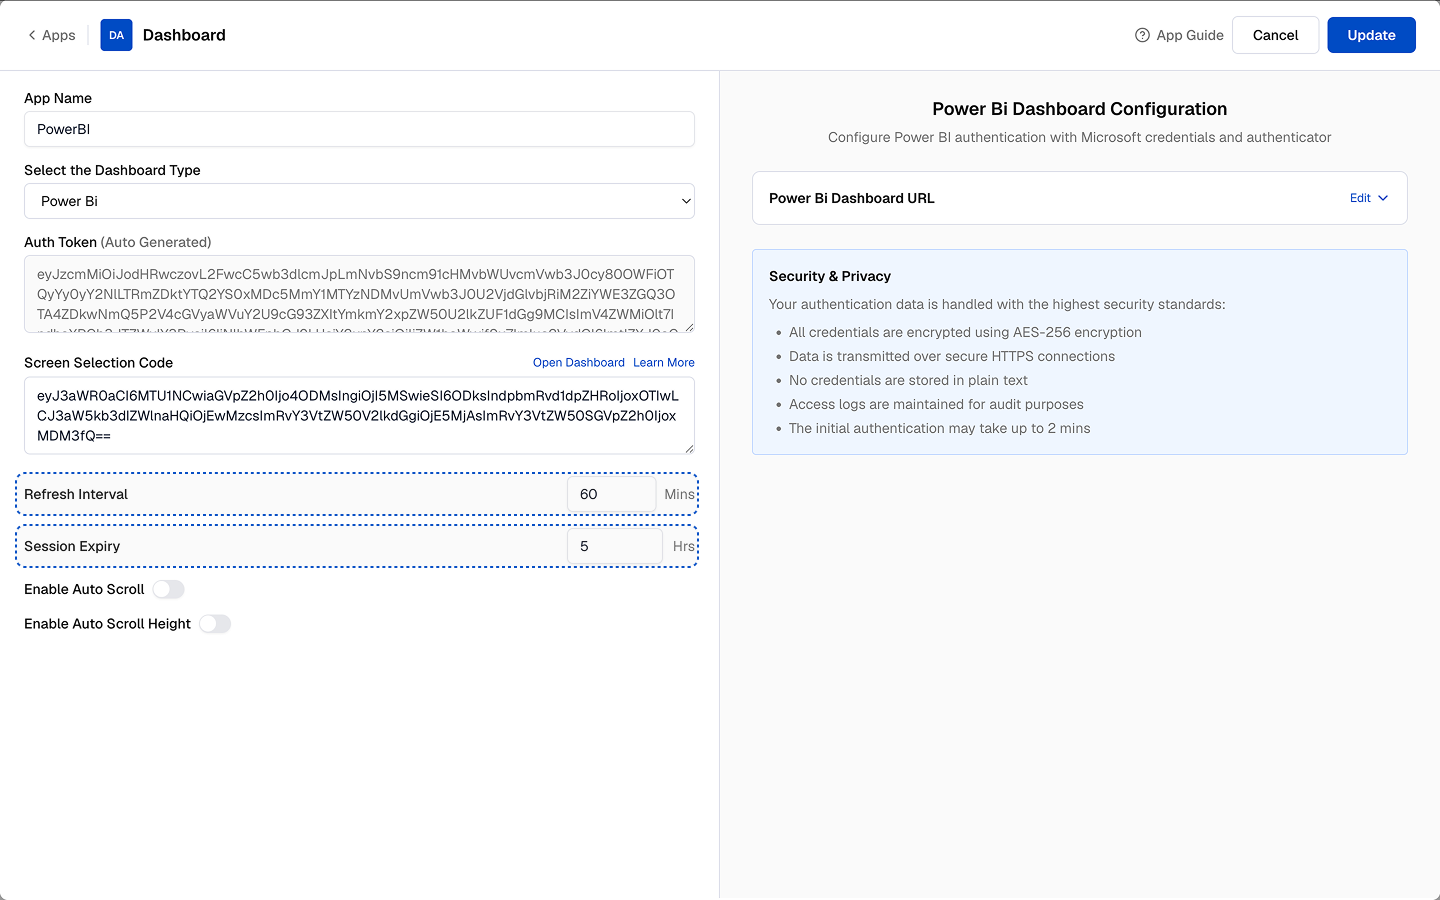
Set Refresh Interval and Session Expiry
- Refresh Interval: How often the dashboard screenshot is updated. For data that changes daily, 60 minutes is a suitable value.
- Session Expiry: Forces a fresh login to prevent session timeouts from the service provider. A value of 5 hours is recommended.
7
Configure auto scroll (optional)
If your dashboard is taller than the visible screen area, enable scrolling: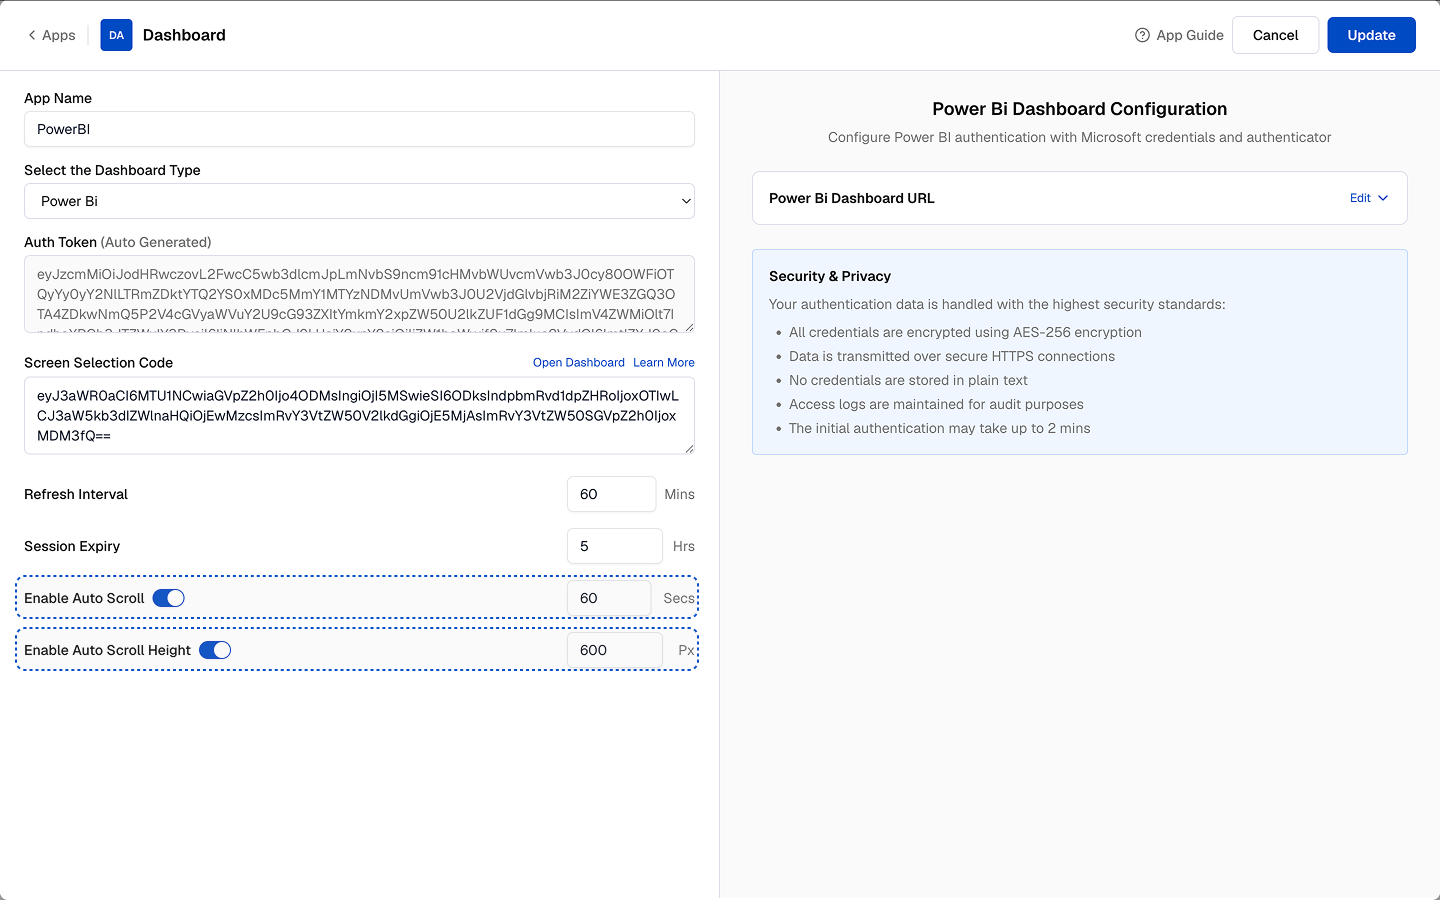
- Enable Auto Scroll: Sets a scroll duration in seconds. The dashboard scrolls from top to bottom over that time. For example, 60 seconds scrolls the full height over one minute.
- Enable Auto Scroll Height: Scrolls down by a fixed number of pixels each cycle.
8
Click Create App
Once all settings are configured, click Create App in the top-right corner to save the app instance.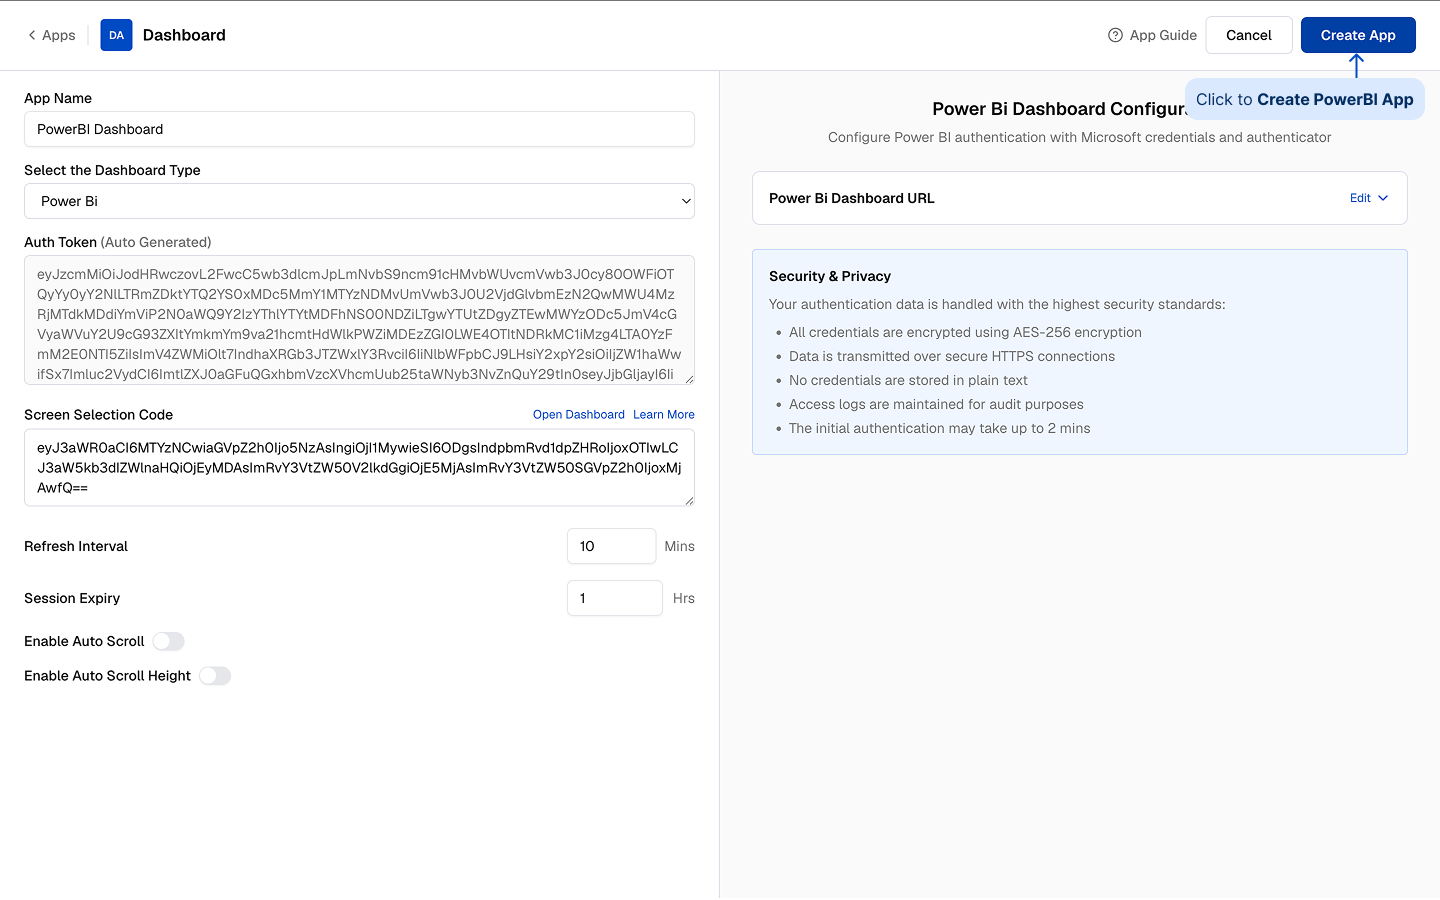
9
Find the app in Content > Media
The new app instance appears in Content > Media. Find it by the name you gave it. The type shows as App.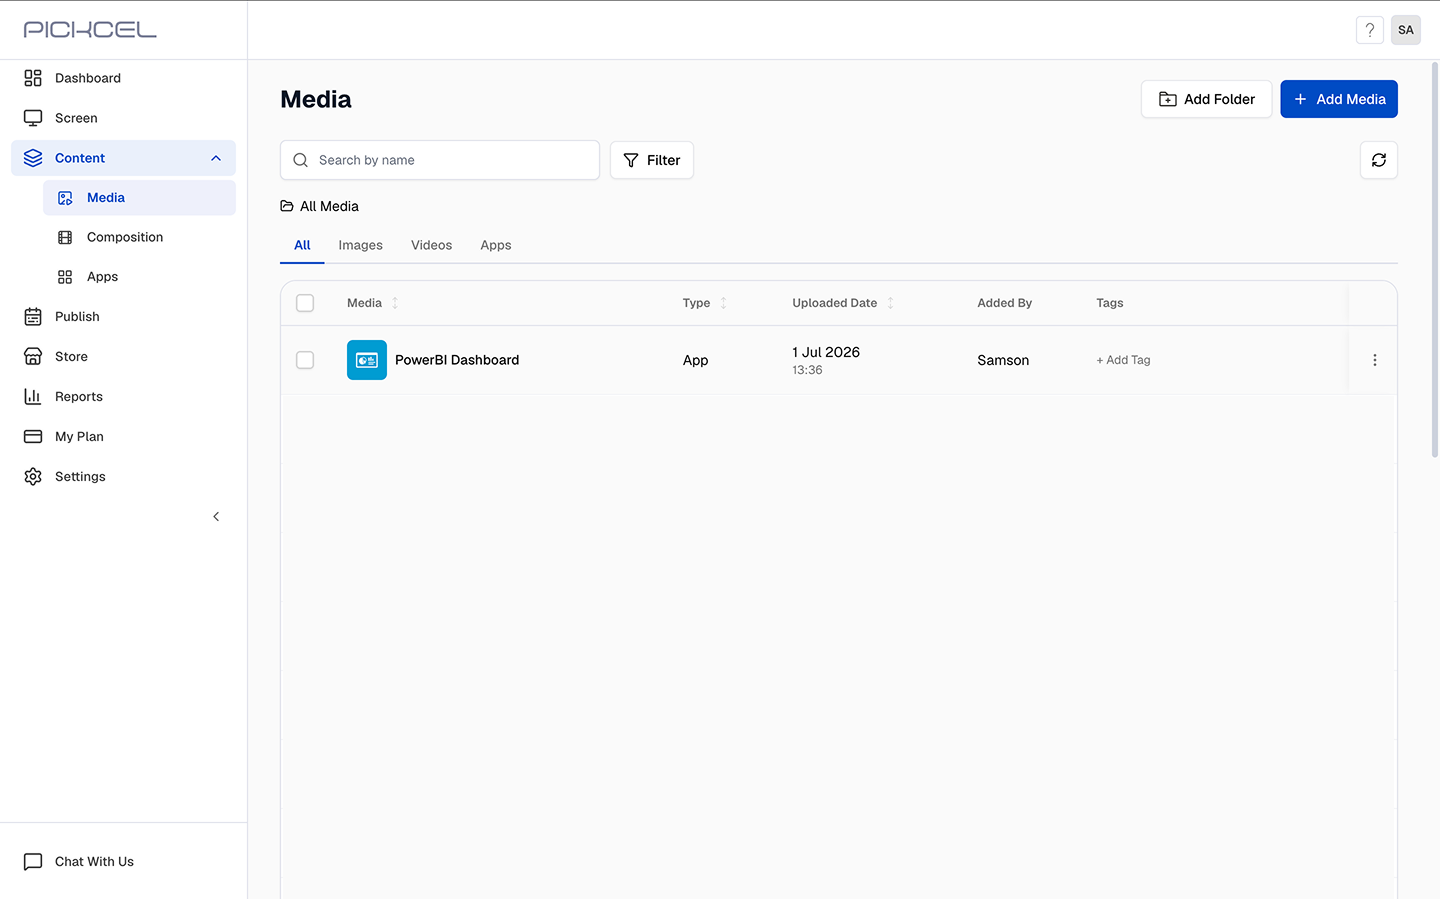
10
Preview the dashboard
Click the app’s thumbnail to open a preview. The Power BI report renders inside the preview modal. If the data looks correct, assign the app to your digital signage screens via a Composition or Quick Play.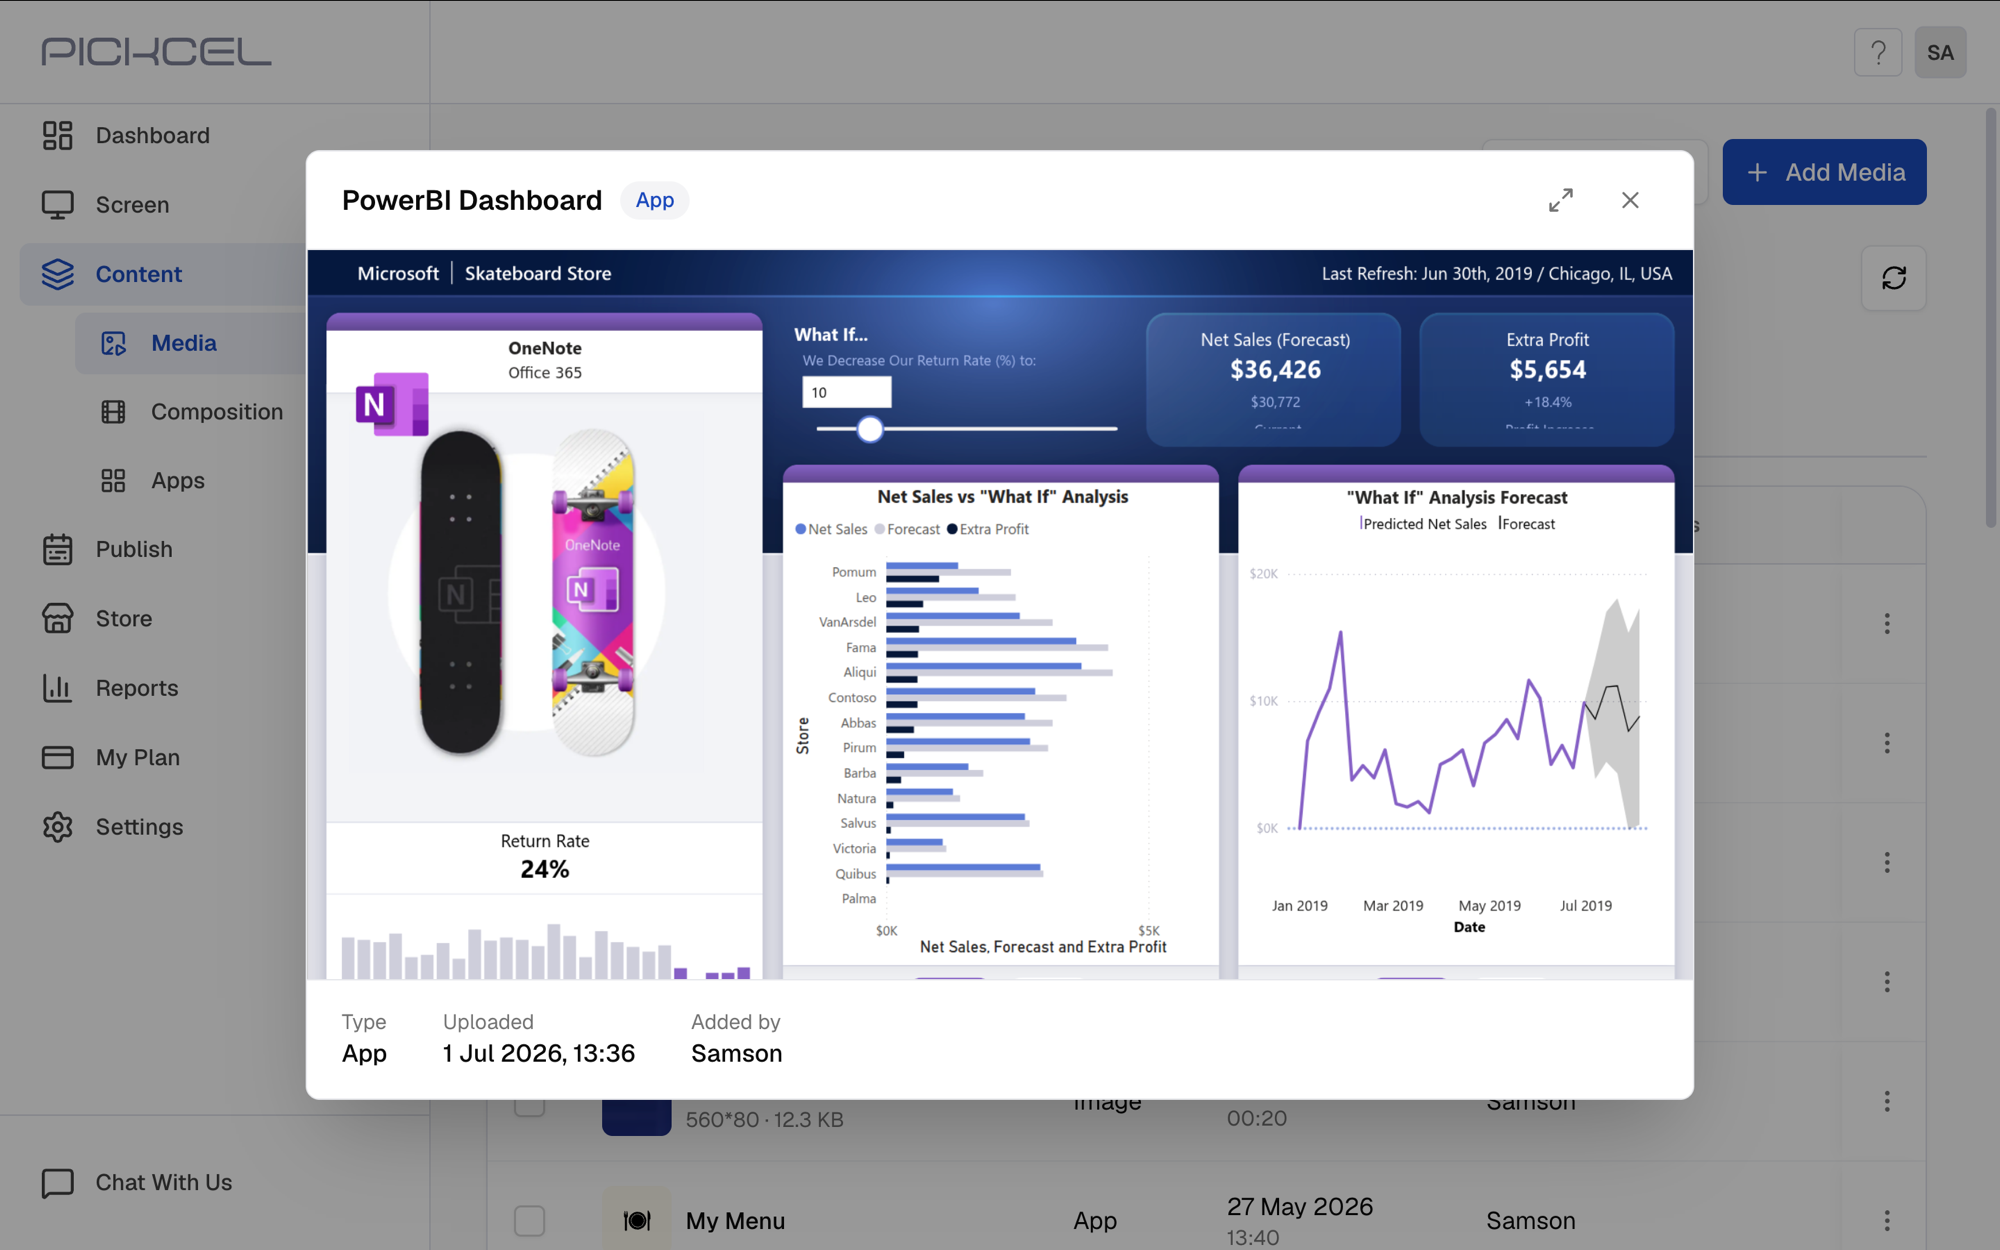
The dashboard may take up to 2 minutes to load on first render, depending on the report size and authentication speed.
What’s Next?
- To create a multi-zone layout: Compositions
- To send it to your screens: Publish or Schedule Content