Use the standalone Power BI app to display interactive reports and dashboards on your digital signage screens with automatic page refresh
The standalone Power BI app is a dedicated Pickcel app for displaying Power BI reports. It connects directly to your Power BI workspace and supports automatic page rotation, making it ideal for real-time dashboards and reports.
Looking for another way? If you need more control over authentication methods or your device is an LG player, use the Dashboard app (Power BI method) instead, which supports server-side login and works across all device types.
A Microsoft account with access to Power BI and the reports you want to display.
Your reports published in a custom or shared workspace — Pickcel cannot access reports from My workspace. If you don’t have one, create a workspace and copy your reports into it.
A Pickcel account — the Power BI app is a Pro app, so make sure your plan includes Pro apps.
1
Search for the app
Log in to your Pickcel account. Go to Content → Apps and search for Power BI.
Click the Microsoft Power BI app card, then click Create App in the app details panel.
2
Sign in with Microsoft
Click Login with Microsoft and sign in with the Microsoft account that has access to your Power BI workspace.
Once authentication succeeds, you’ll see a Microsoft account connected confirmation and the app configuration form.
3
Enter app name
Give a suitable name to your app, e.g. PowerBI Sales Report.
4
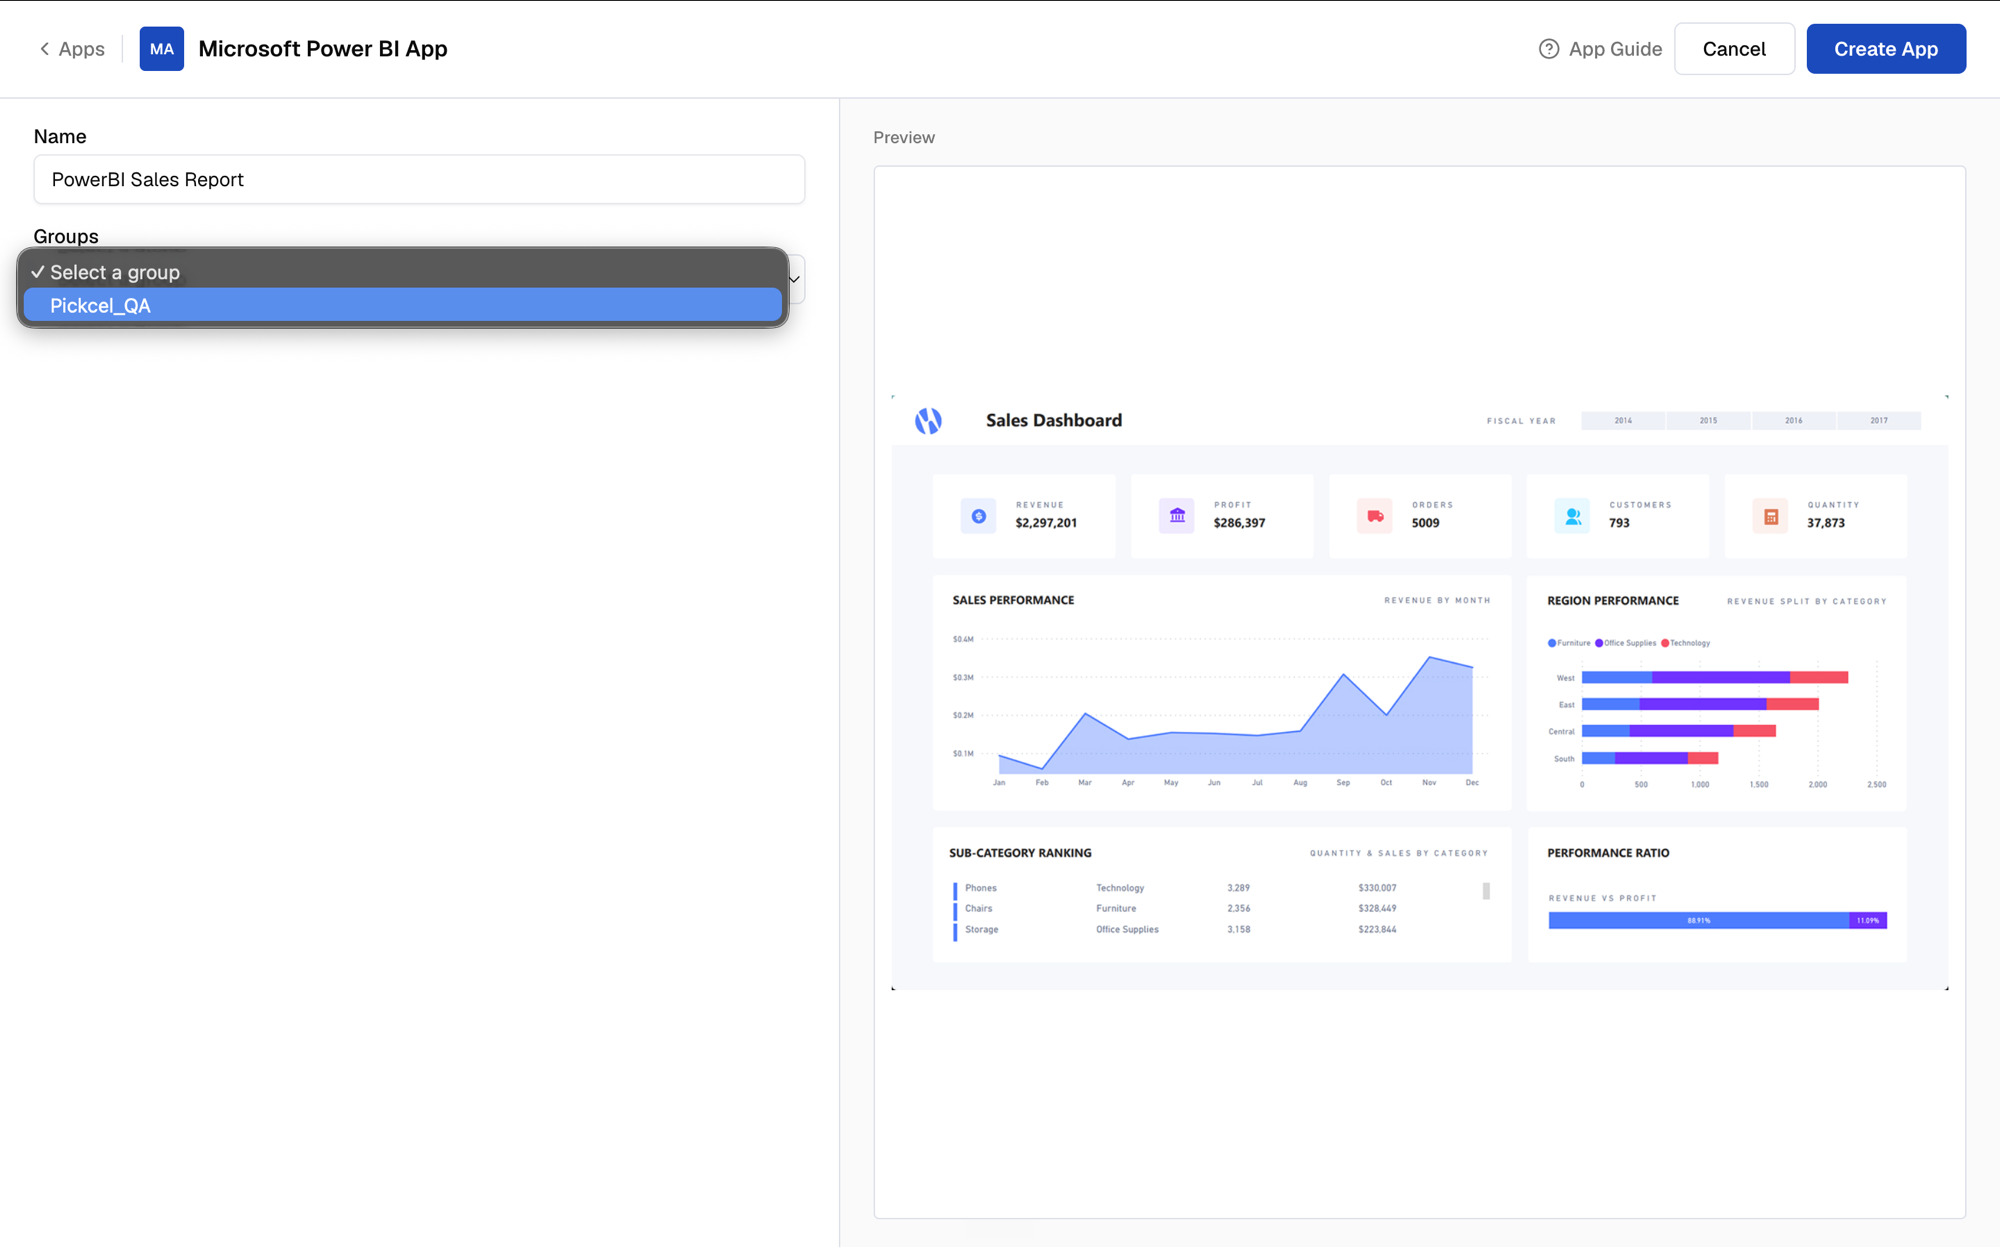
Select a group
The Groups dropdown lists the workspaces from your Power BI account. Select the workspace that contains your report.
A group in Pickcel corresponds to a workspace in Power BI. Make sure your reports are in a custom or shared workspace — Pickcel cannot access reports from My workspace.
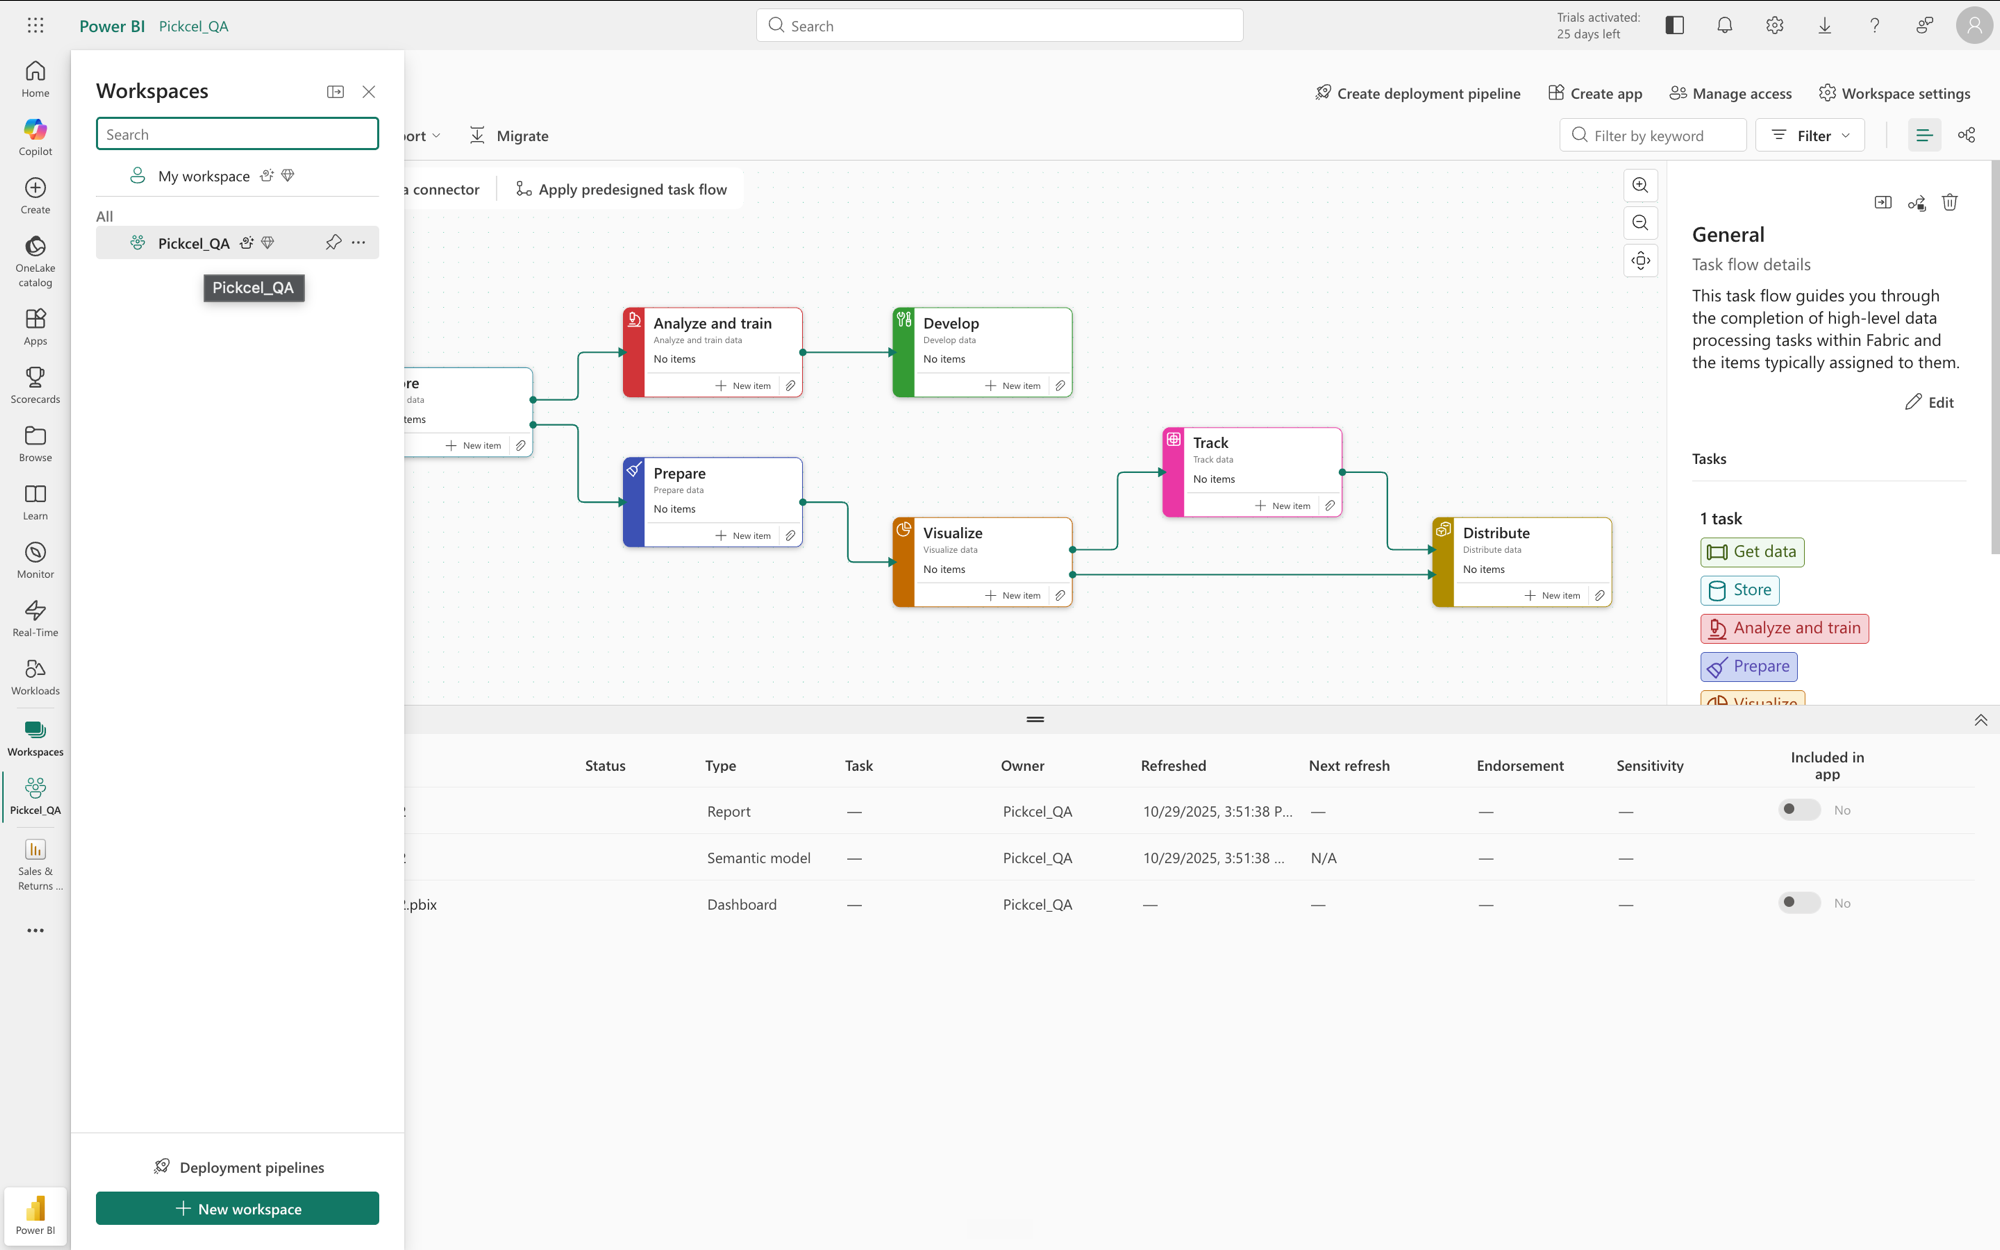
Where do groups come from in Power BI?
In Power BI, open Workspaces from the left navigation. Every workspace listed there (other than My workspace) appears as a group in Pickcel.
Inside the workspace you can see the reports, semantic models, and dashboards it contains — the reports are what Pickcel can display.
The Reports dropdown lists all reports in the selected workspace. Choose the one you want to display.
6
Choose the page display mode
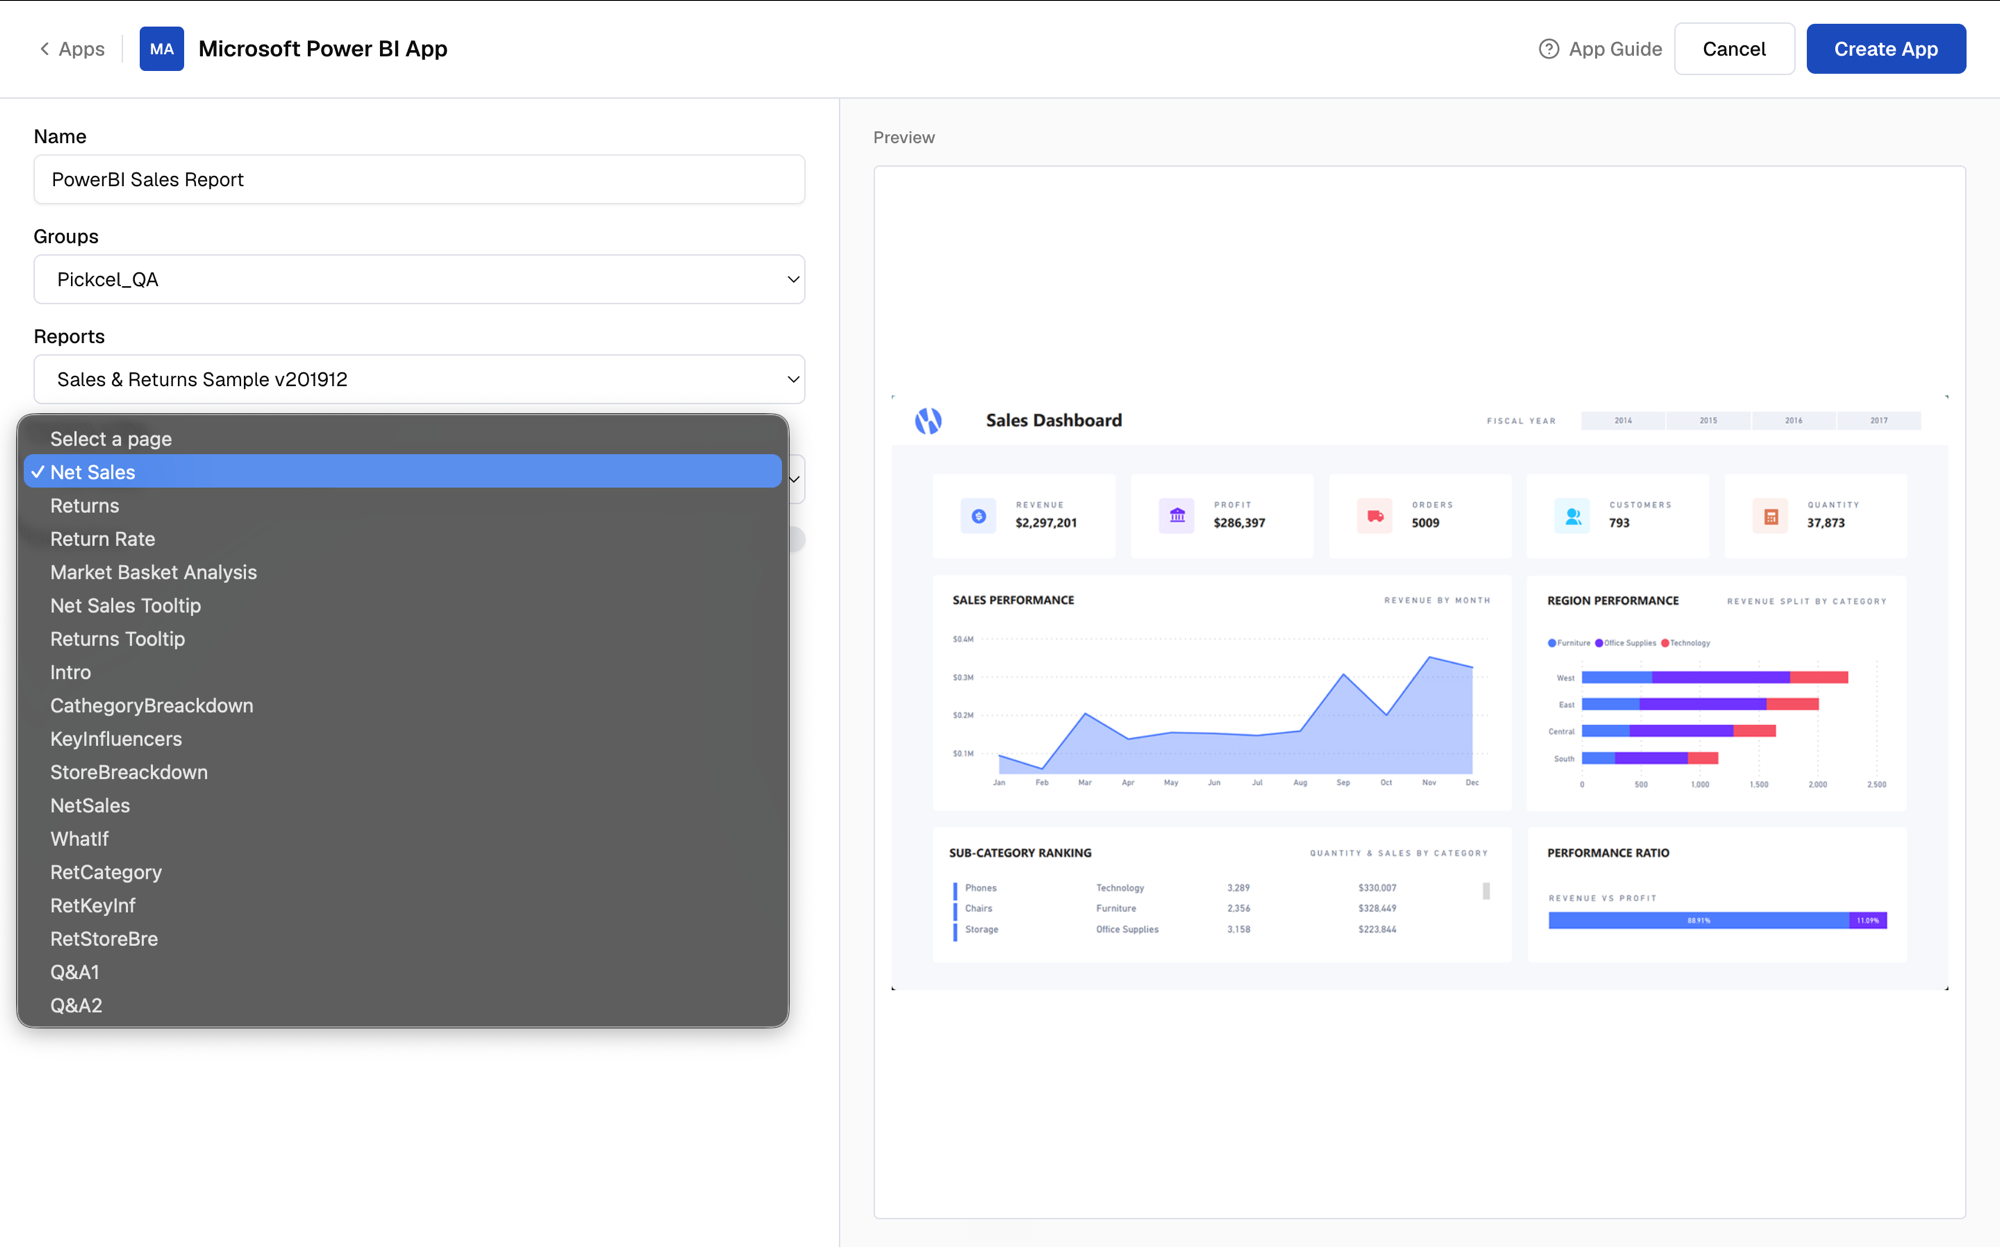
Single page (Default Page): choose a specific report page to display.
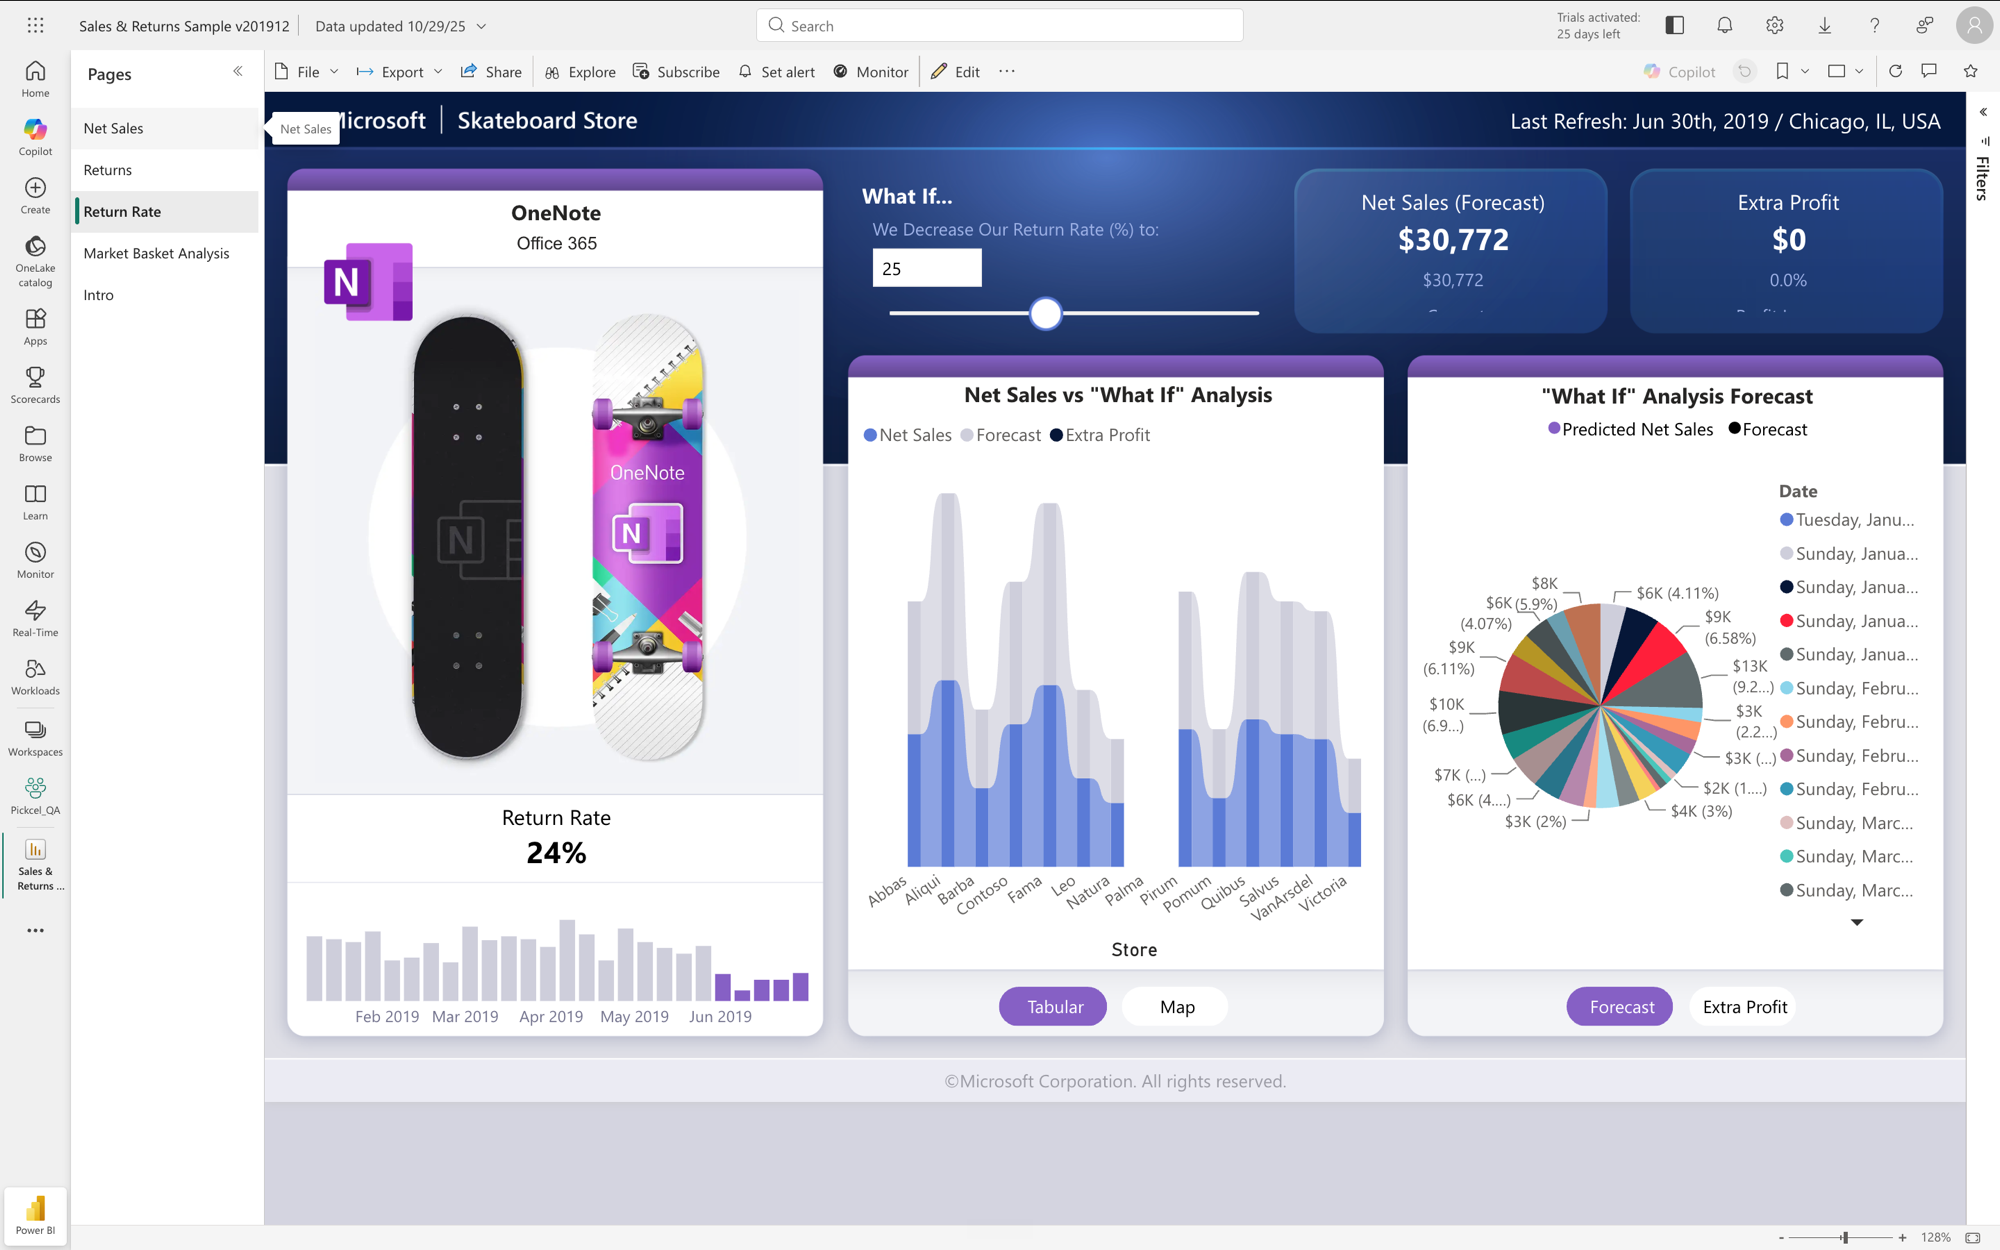
The pages listed here are the same pages you see in the report in Power BI. Viewers can still switch pages manually using the page tabs at the bottom of the report.
The same report pages in Power BI
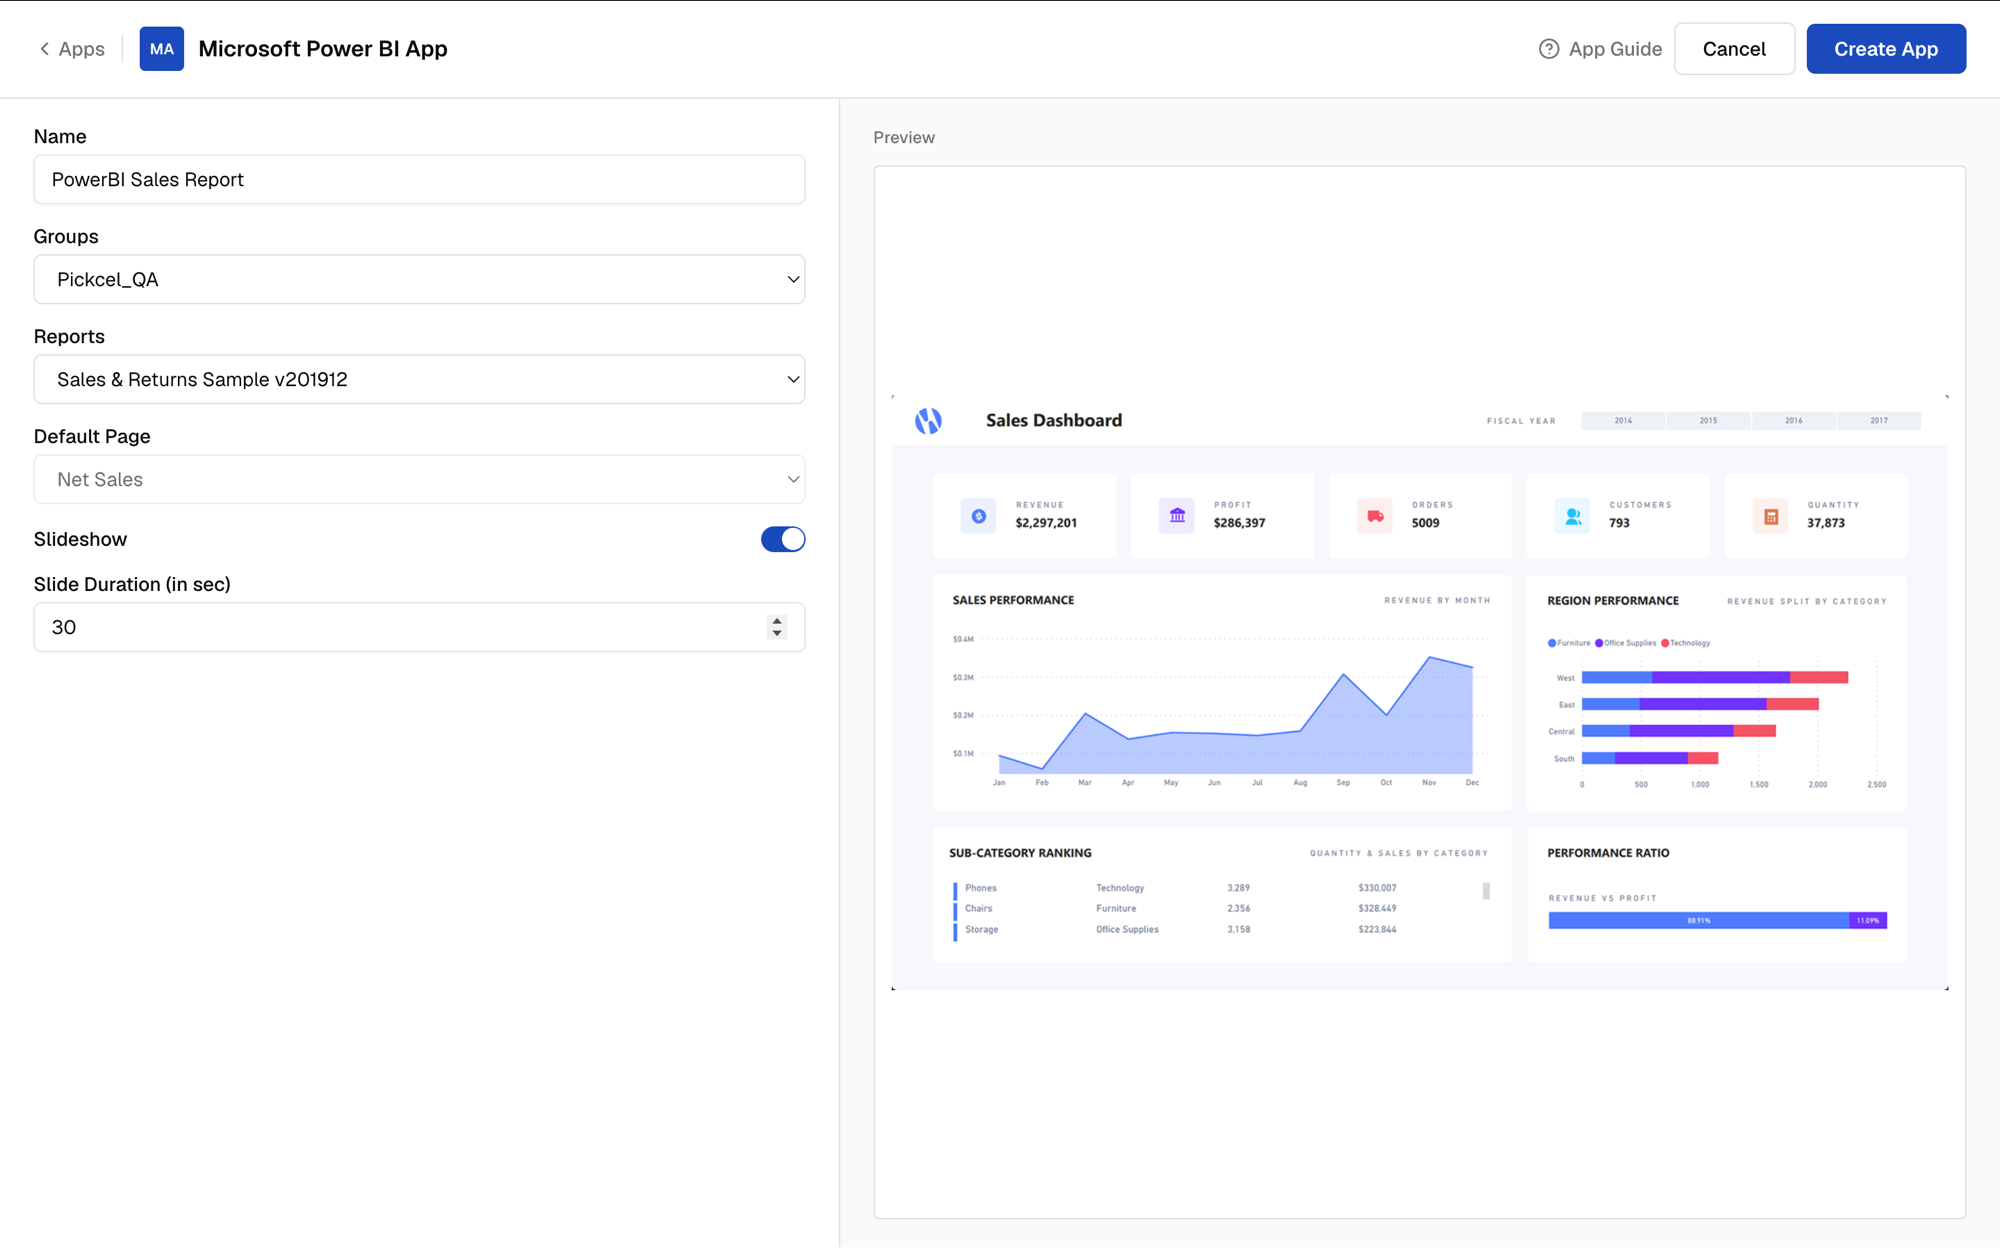
ORMultiple pages (Slideshow): enable the Slideshow toggle to automatically cycle through all pages in the report, and set the Slide Duration for how long each page is displayed.
7
Create the app
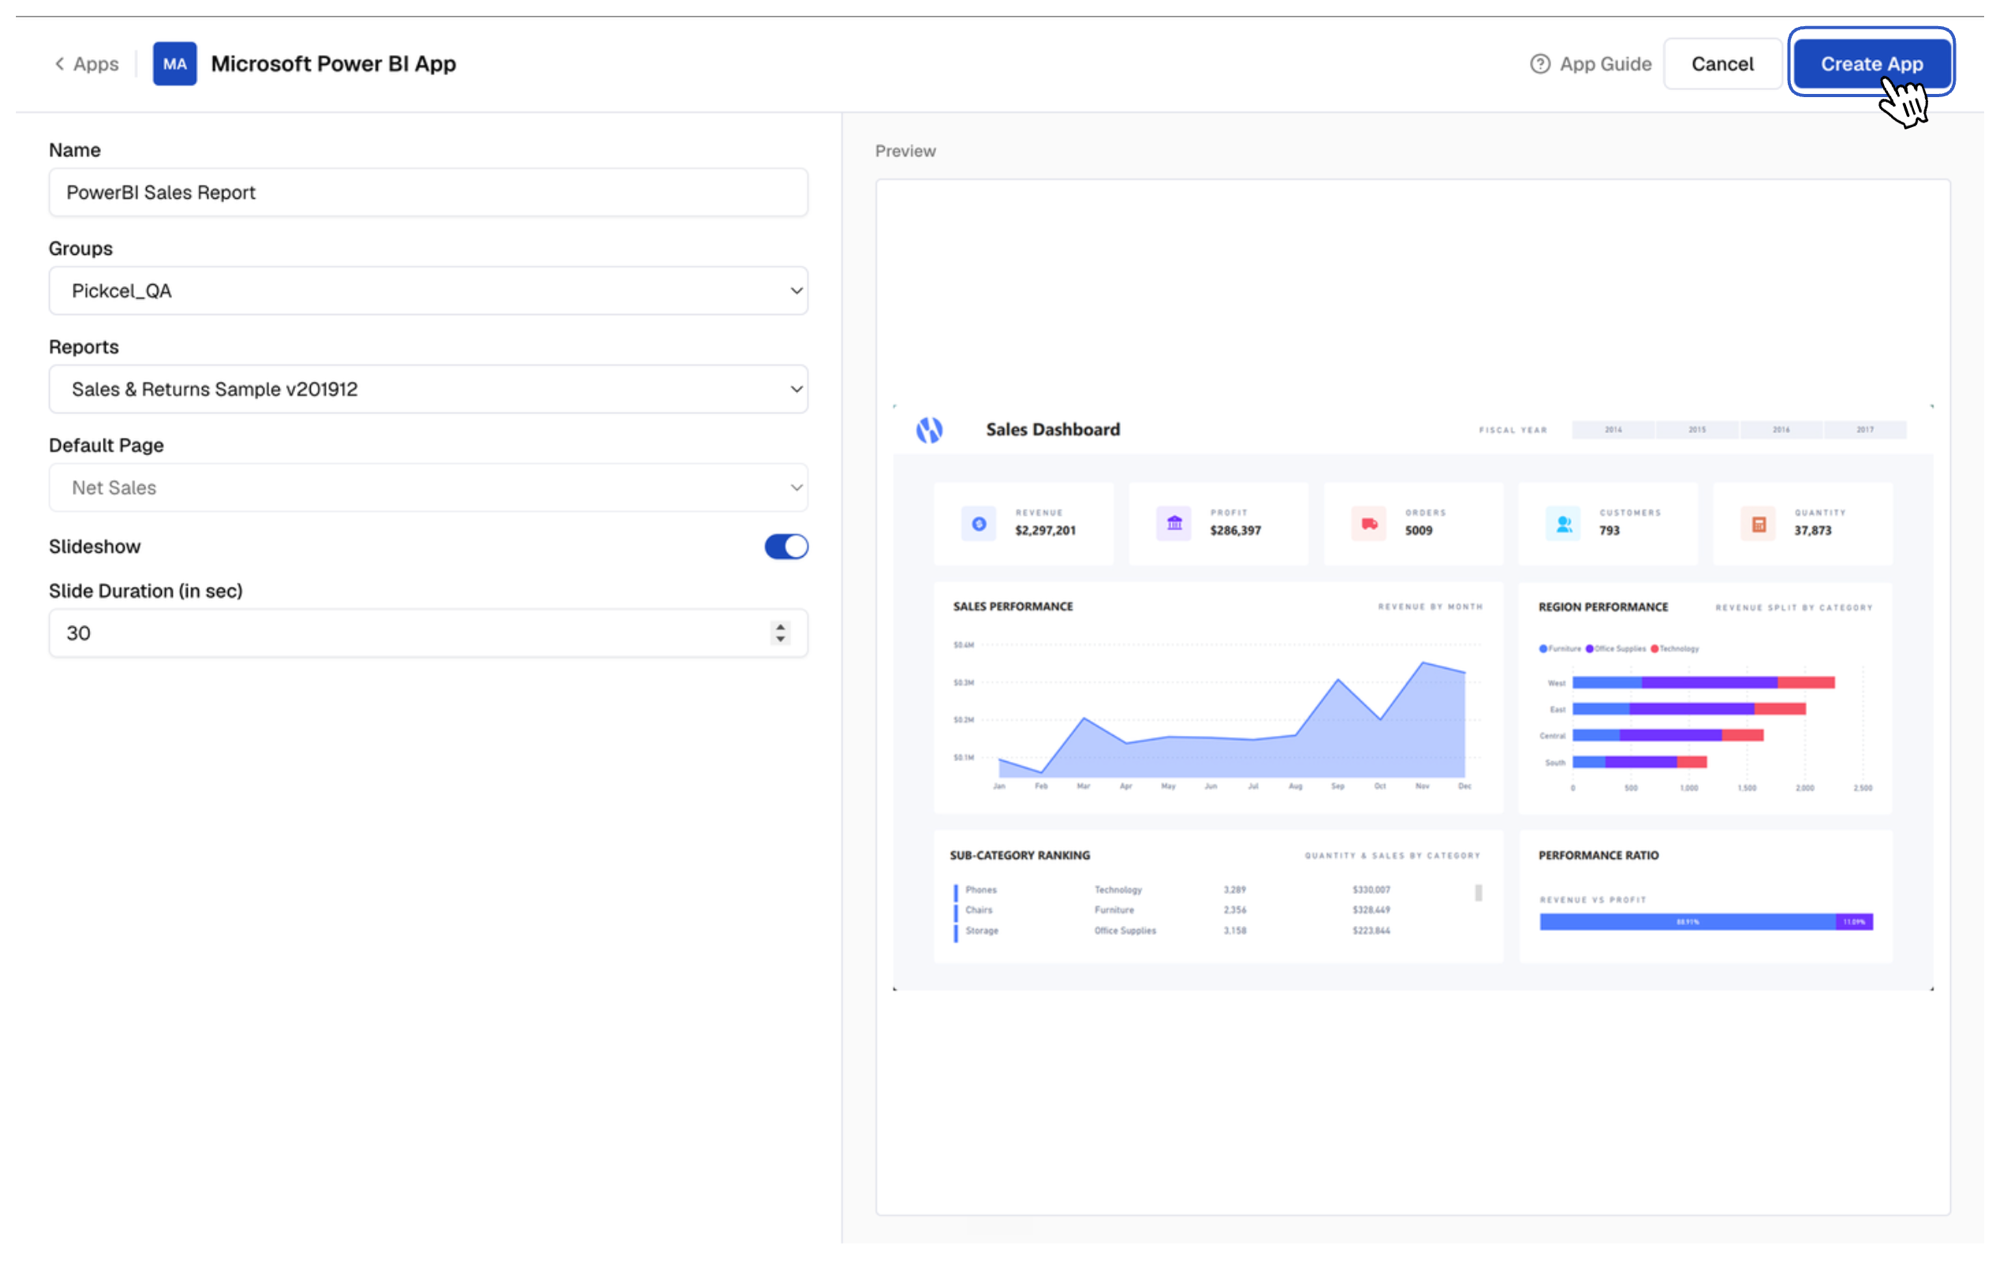
Click Create App to save your configuration.
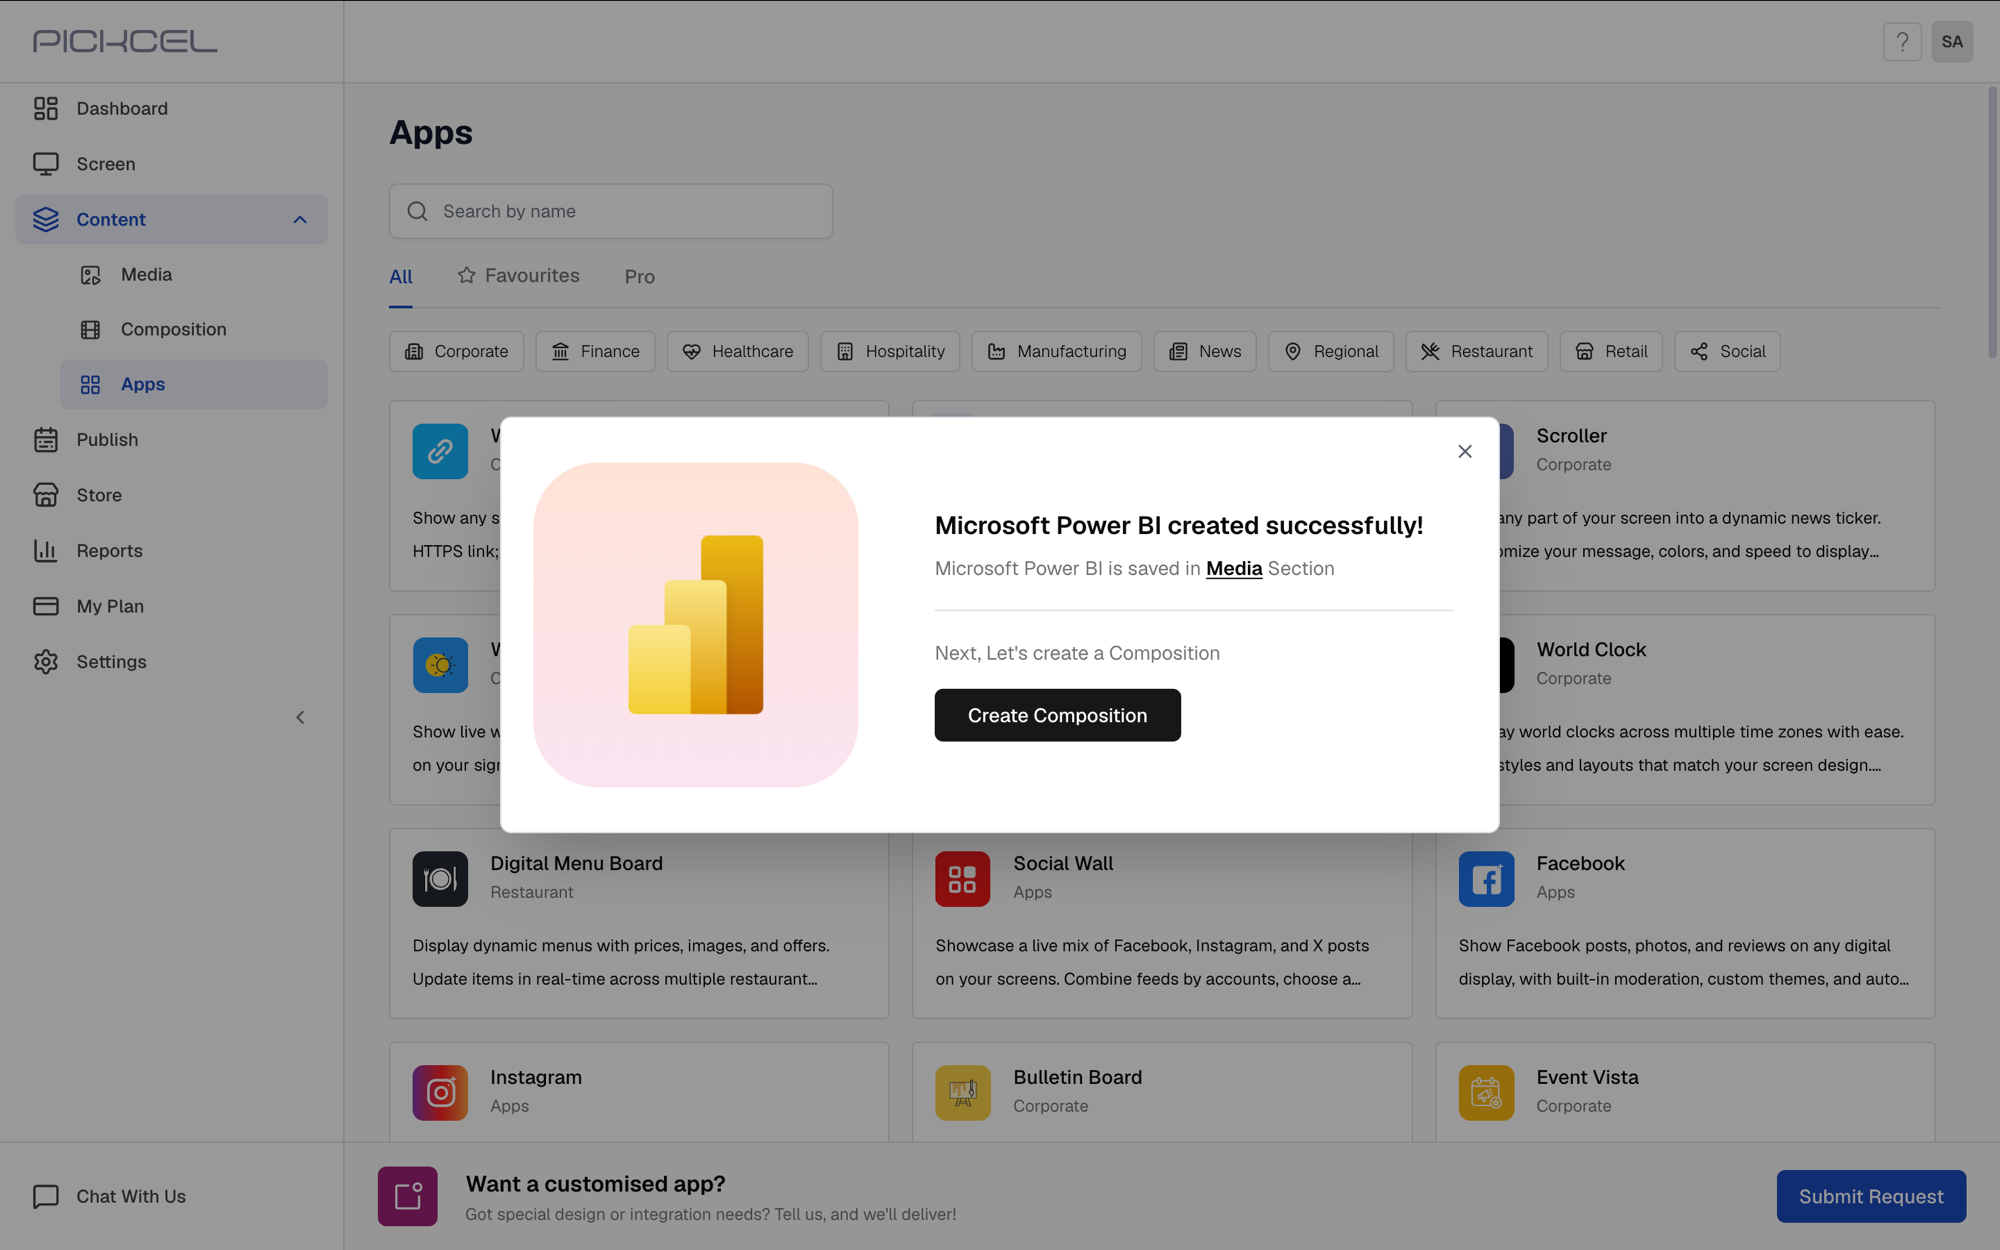
A confirmation appears once the app is created — it is saved to your Media library.
8
Preview the app
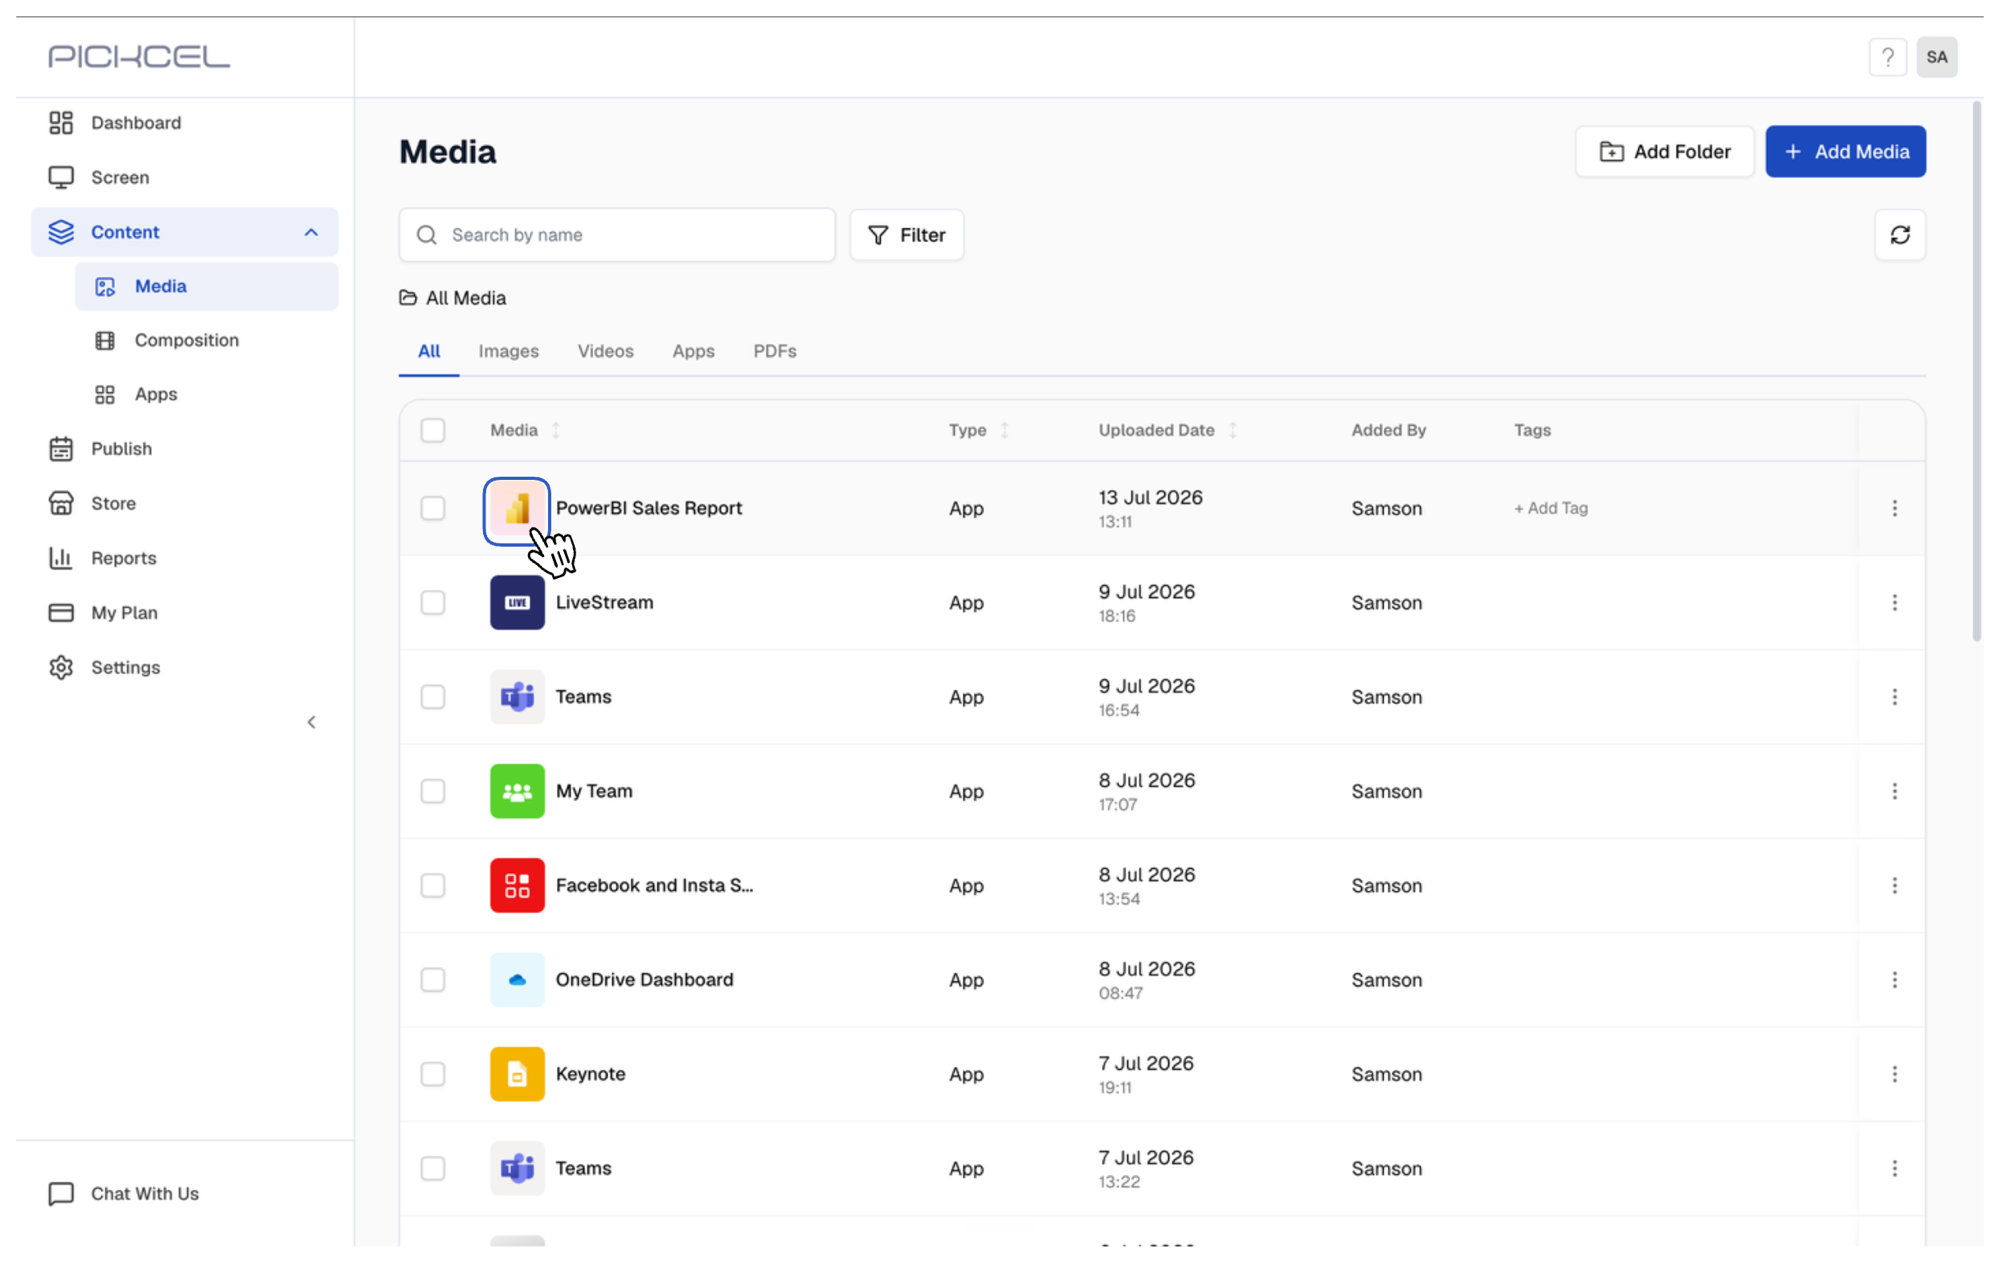
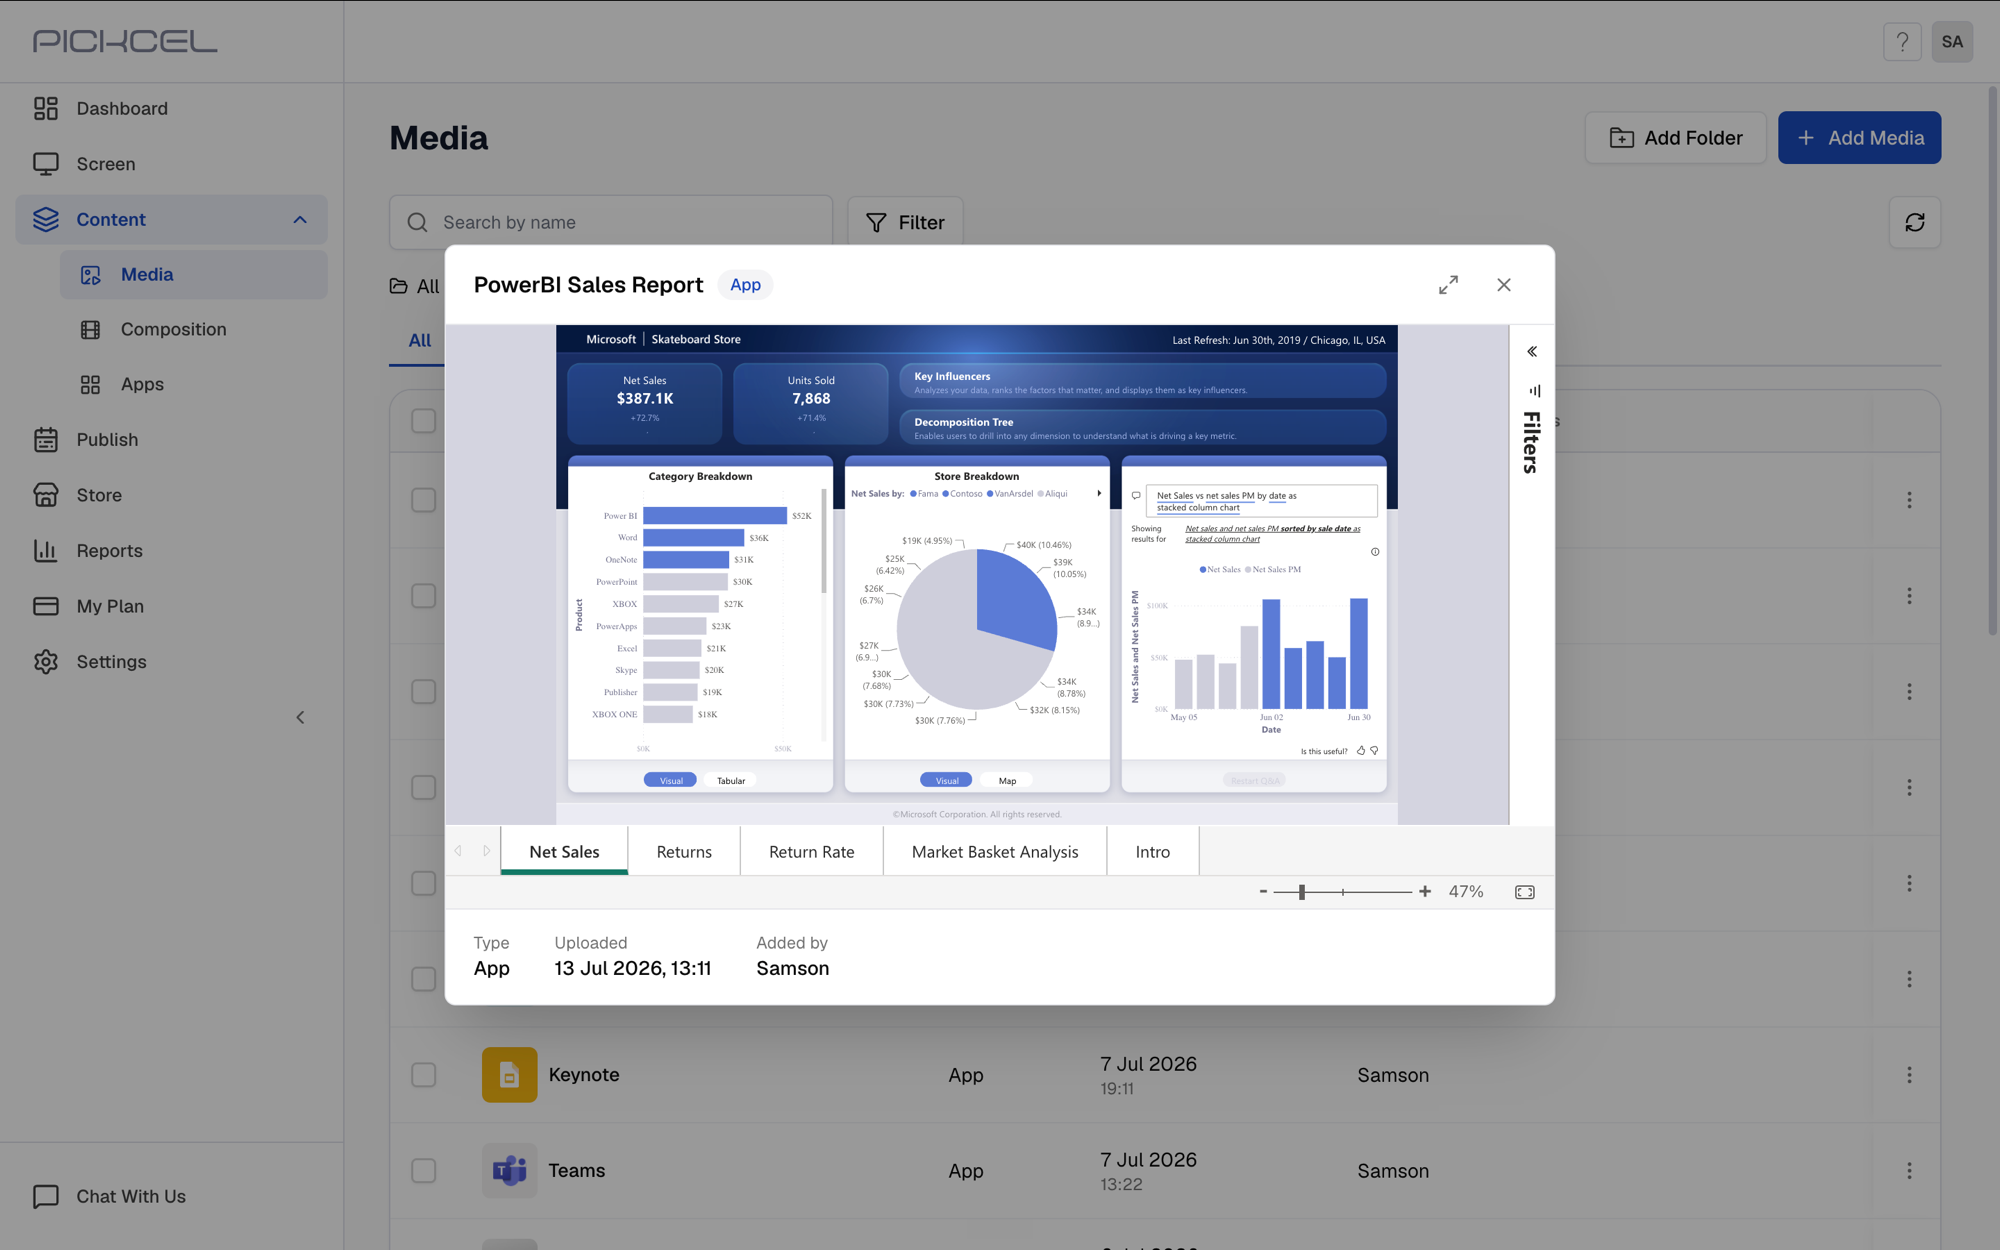
Go to Content → Media and click the app’s thumbnail to preview it.
Preview of the Power BI report
This dedicated Power BI app is not supported on LG devices. If you are using an LG player, please use the Dashboard app configured for Power BI instead.


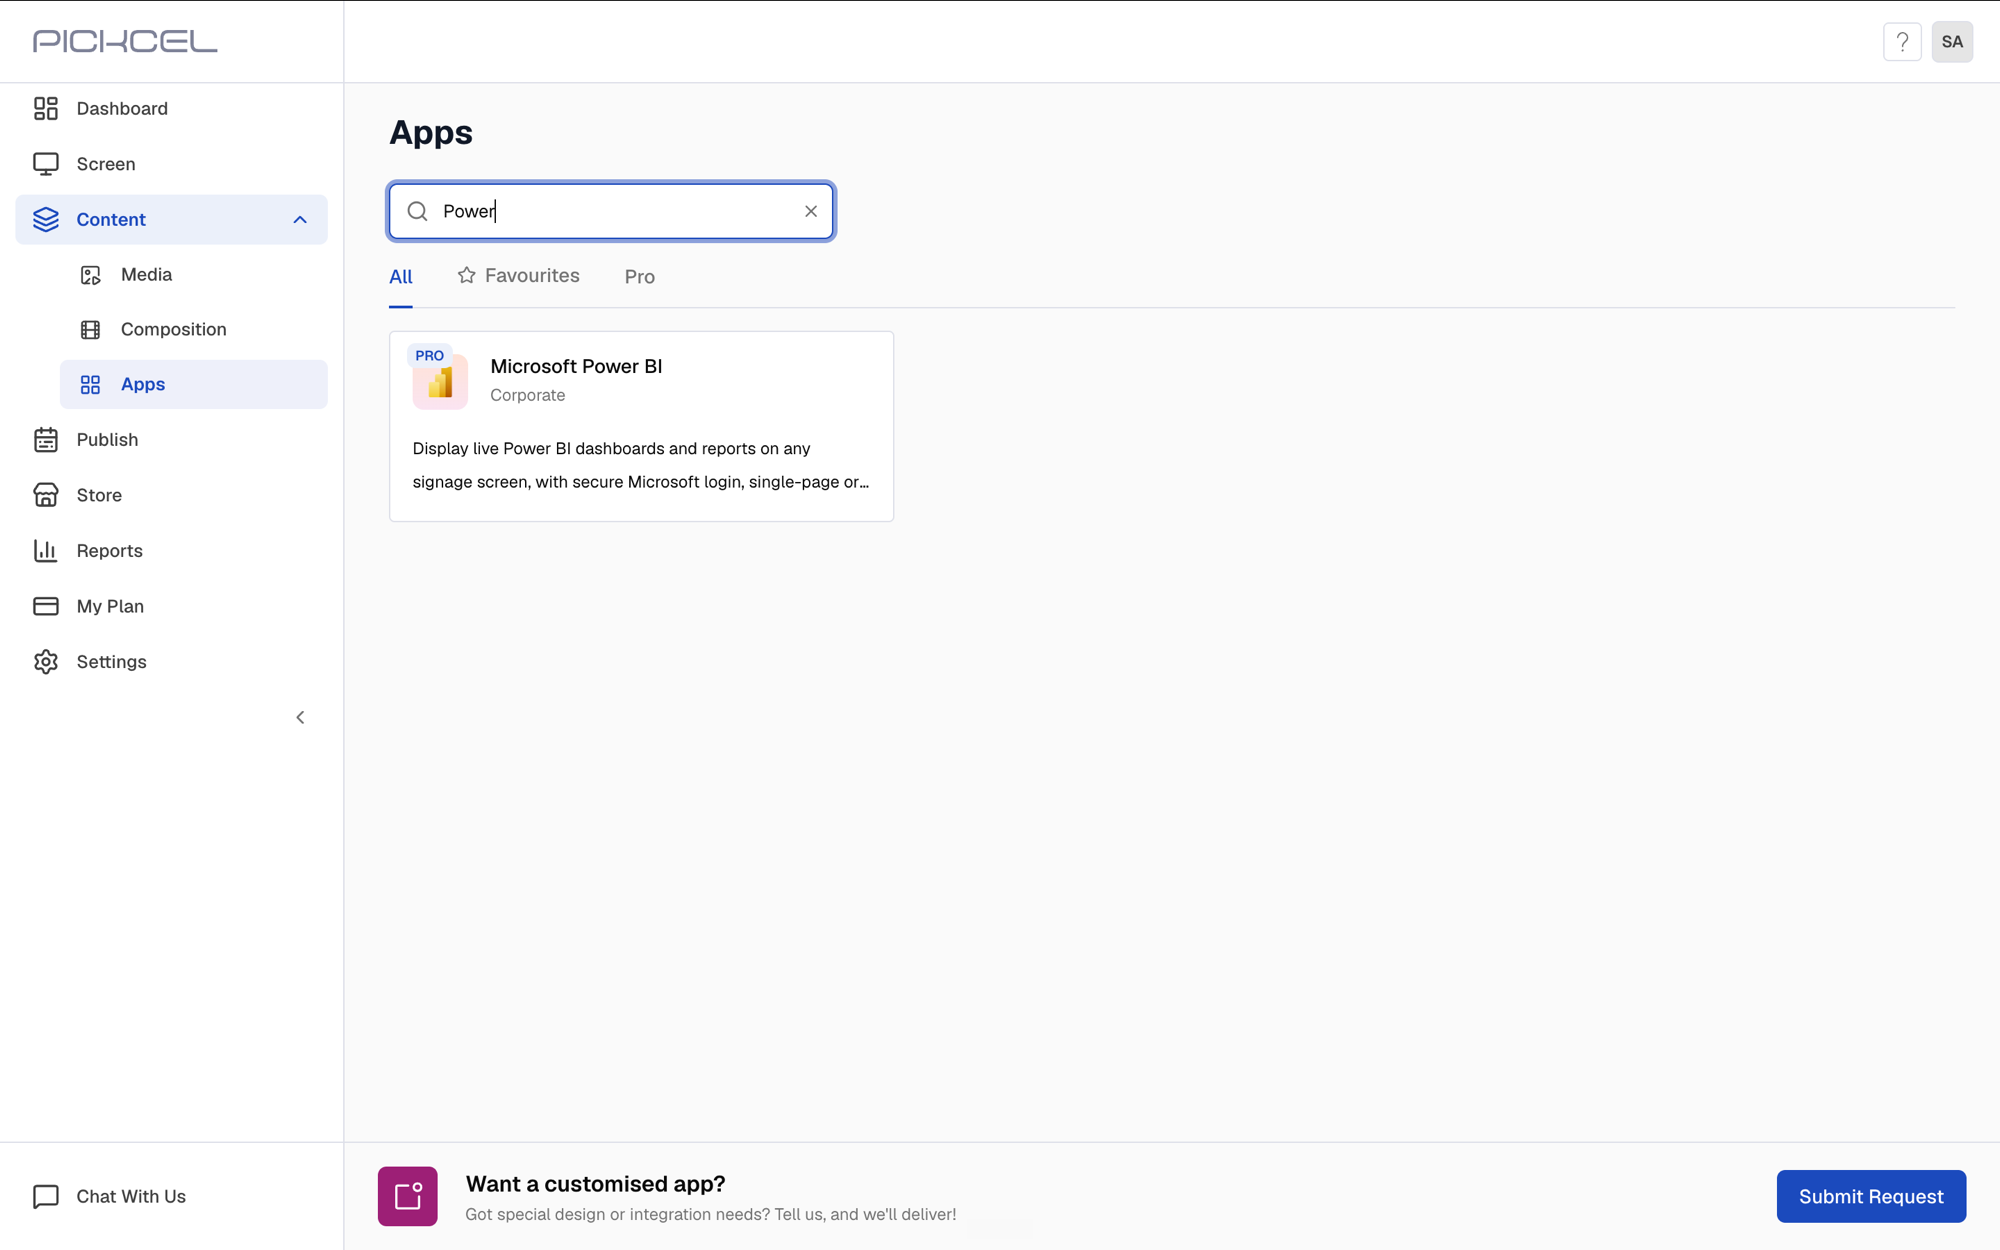 Click the Microsoft Power BI app card, then click Create App in the app details panel.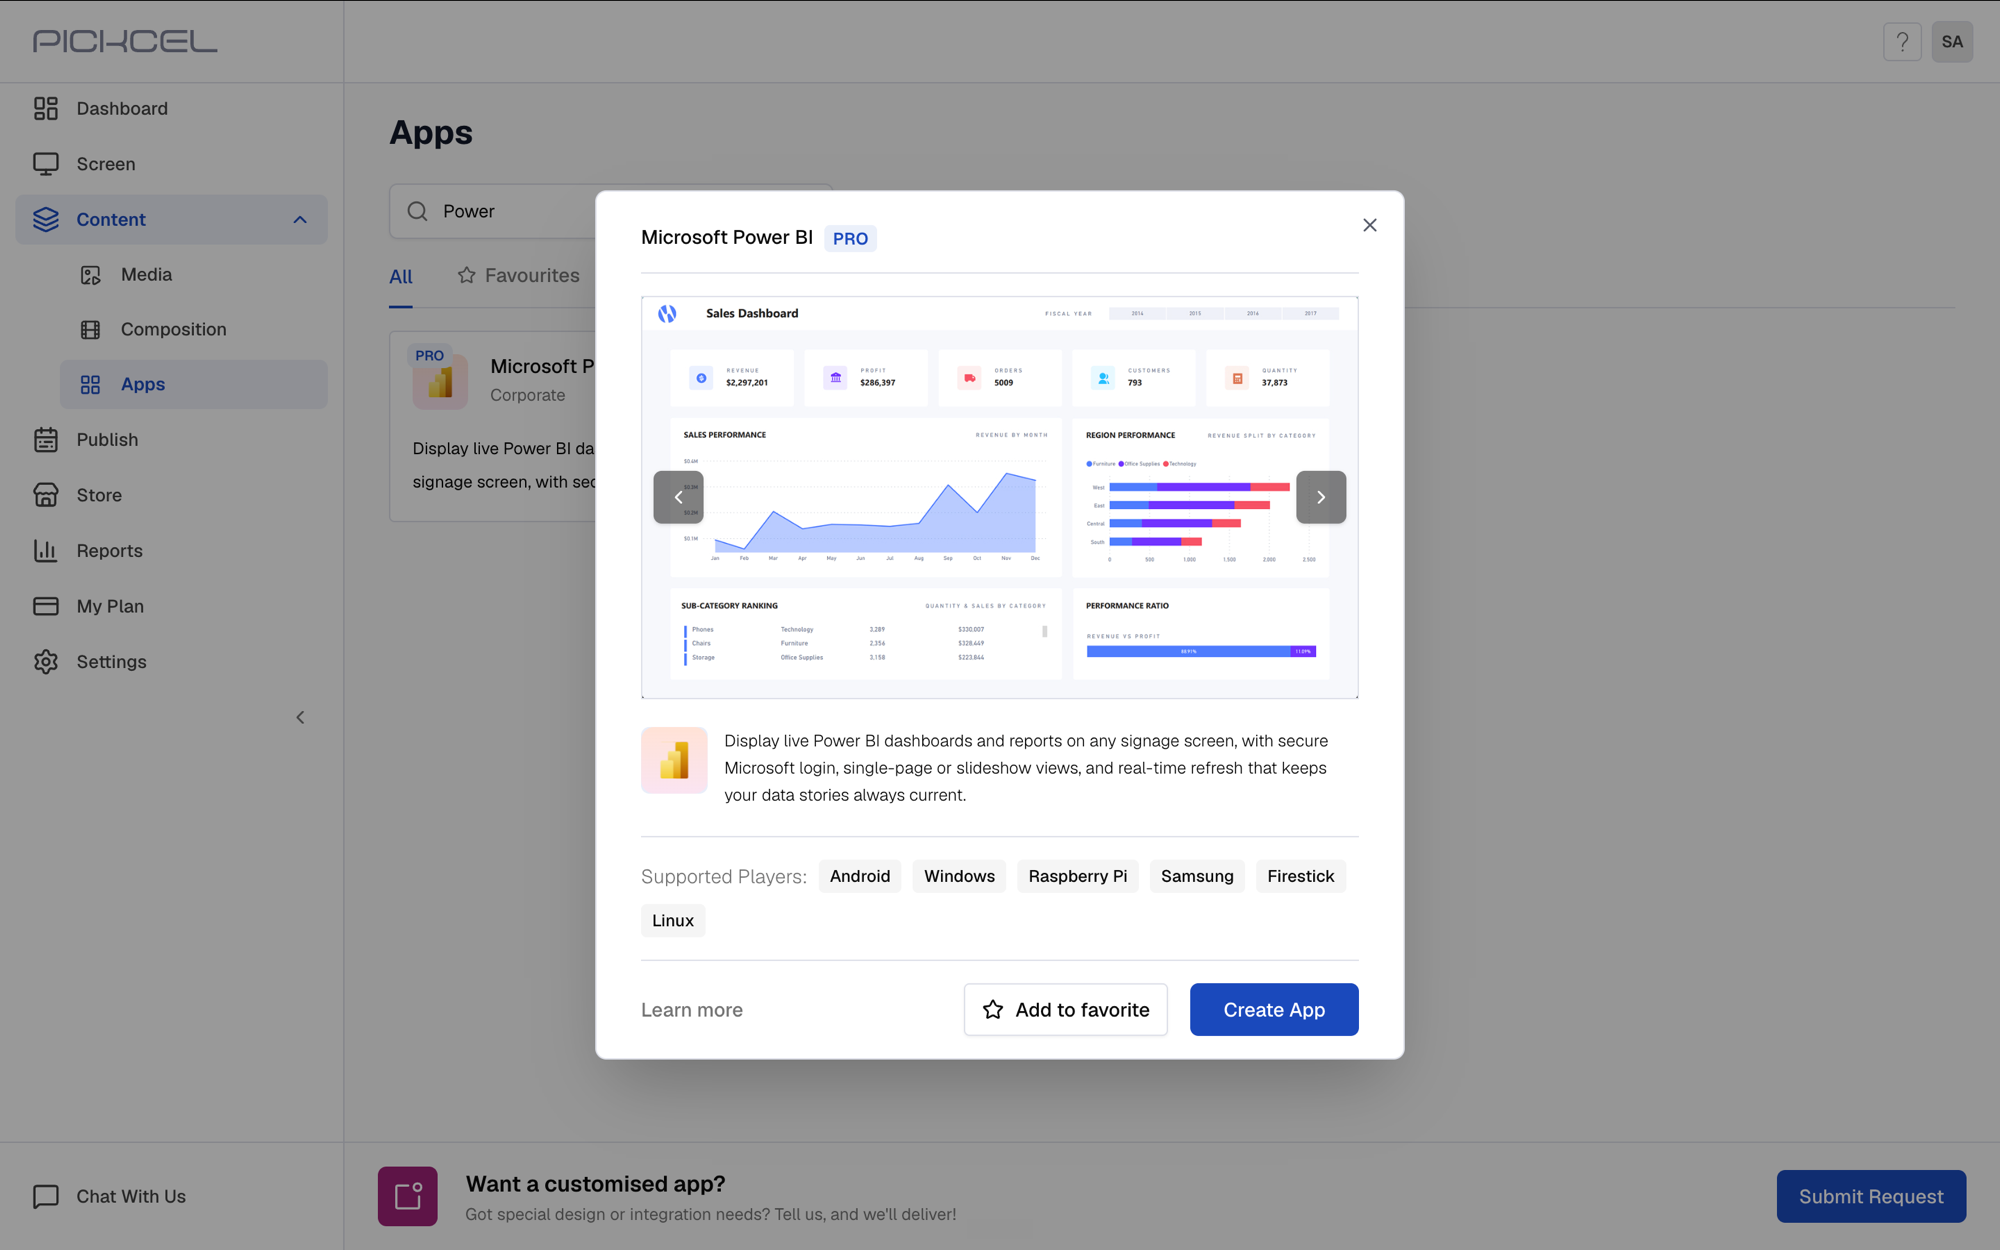
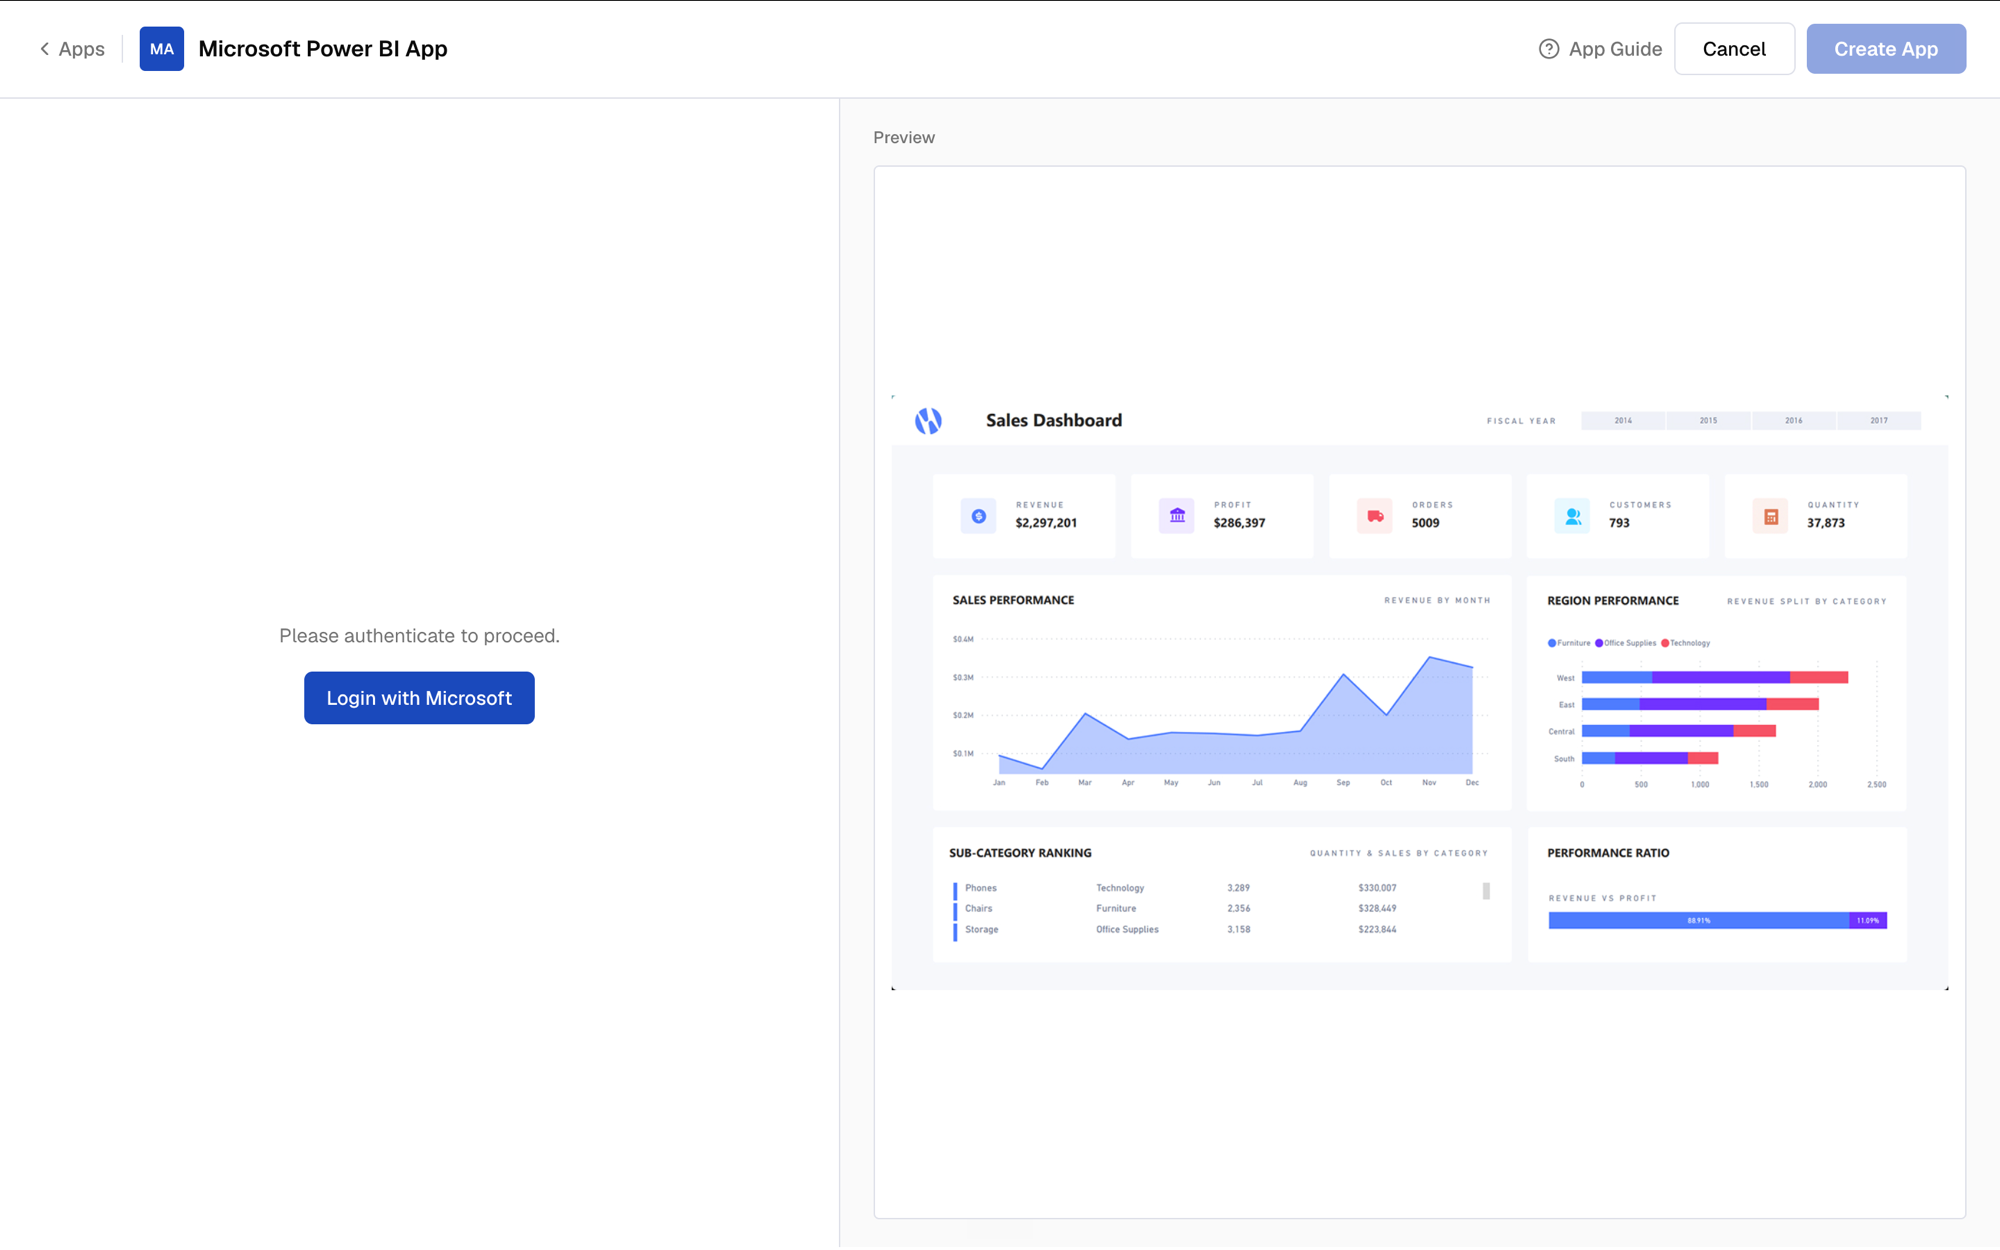 Once authentication succeeds, you’ll see a Microsoft account connected confirmation and the app configuration form.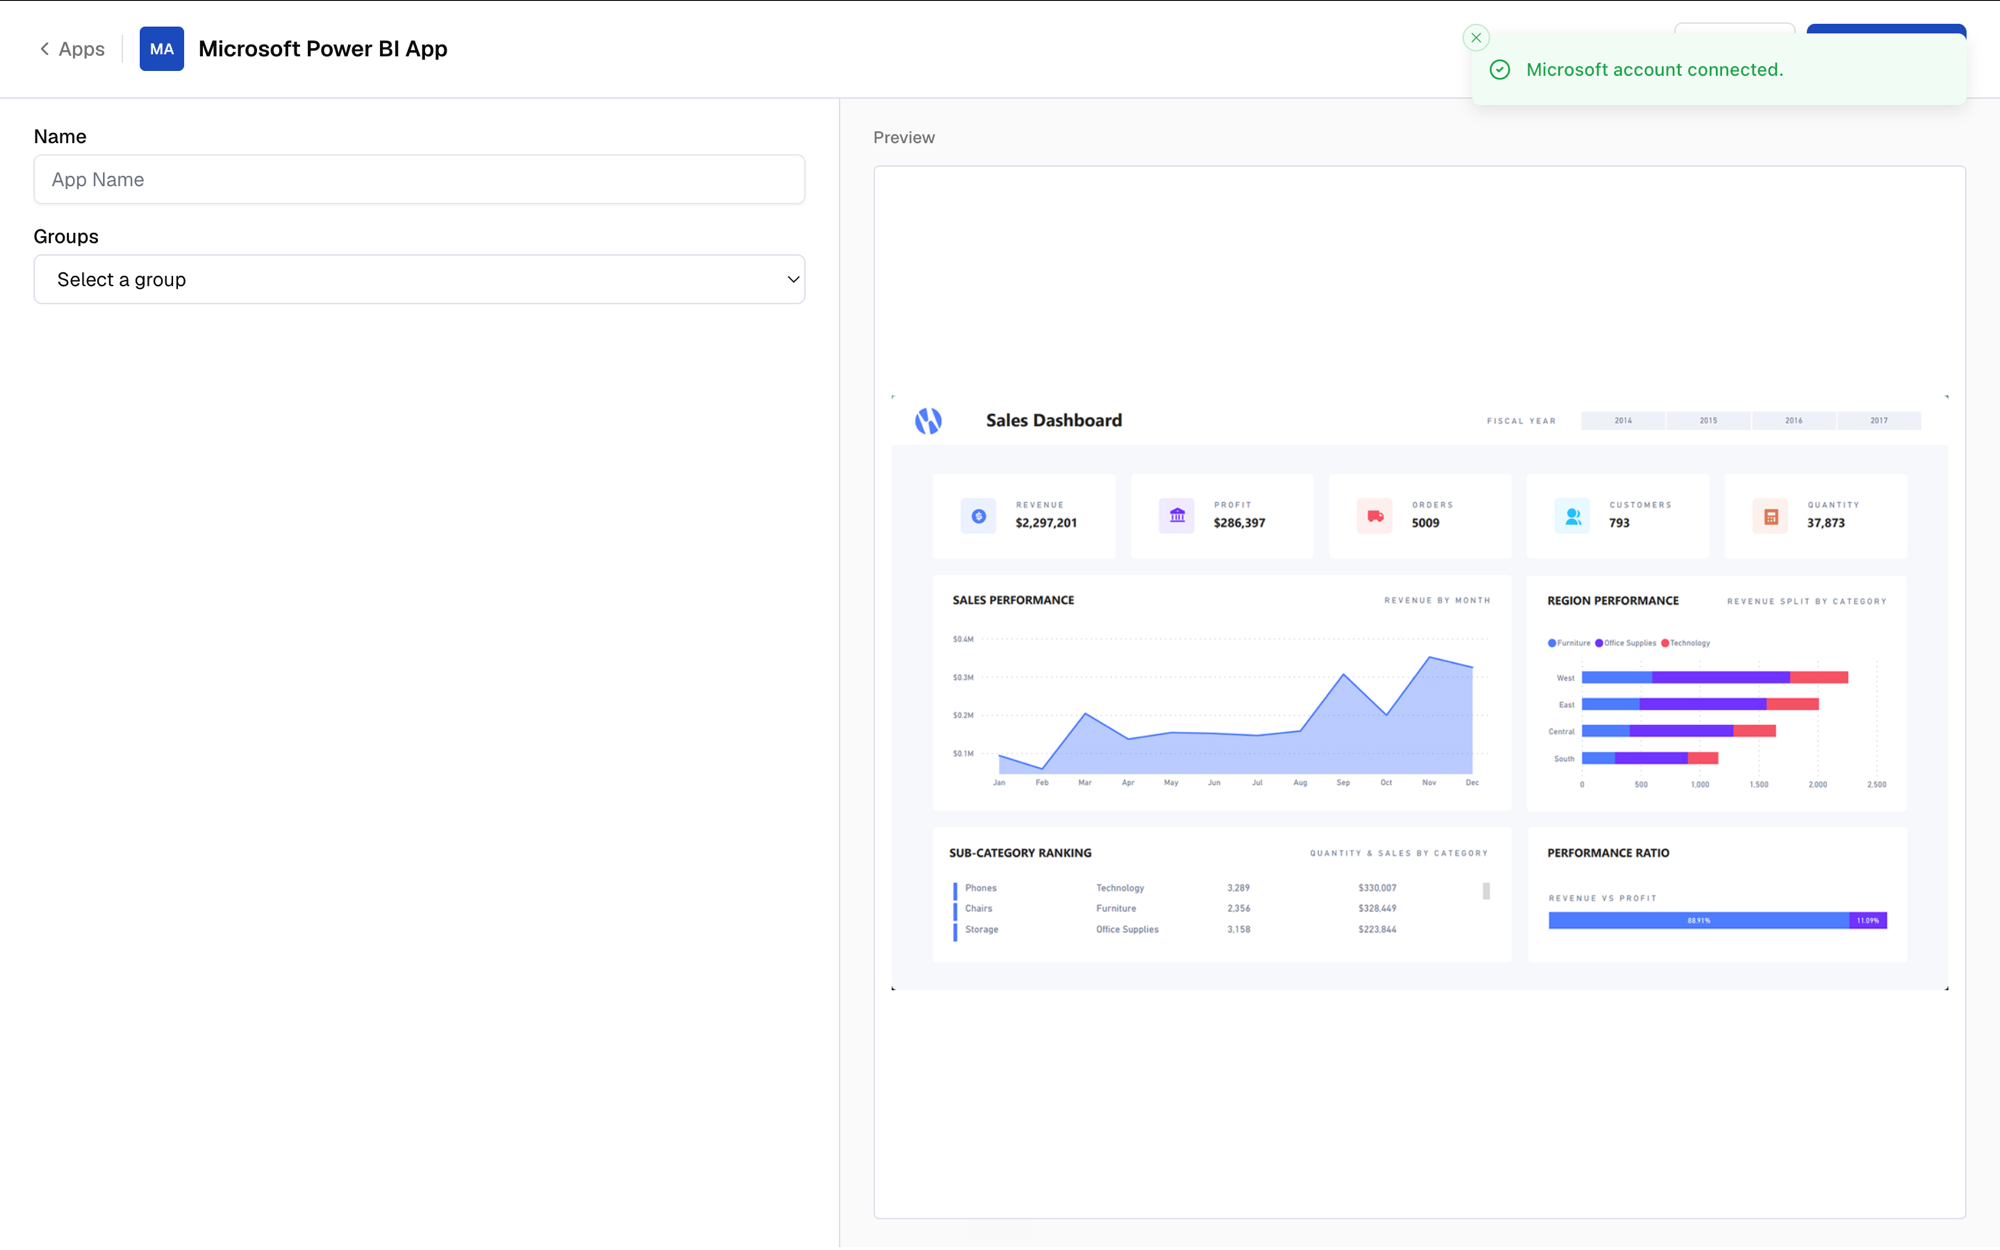
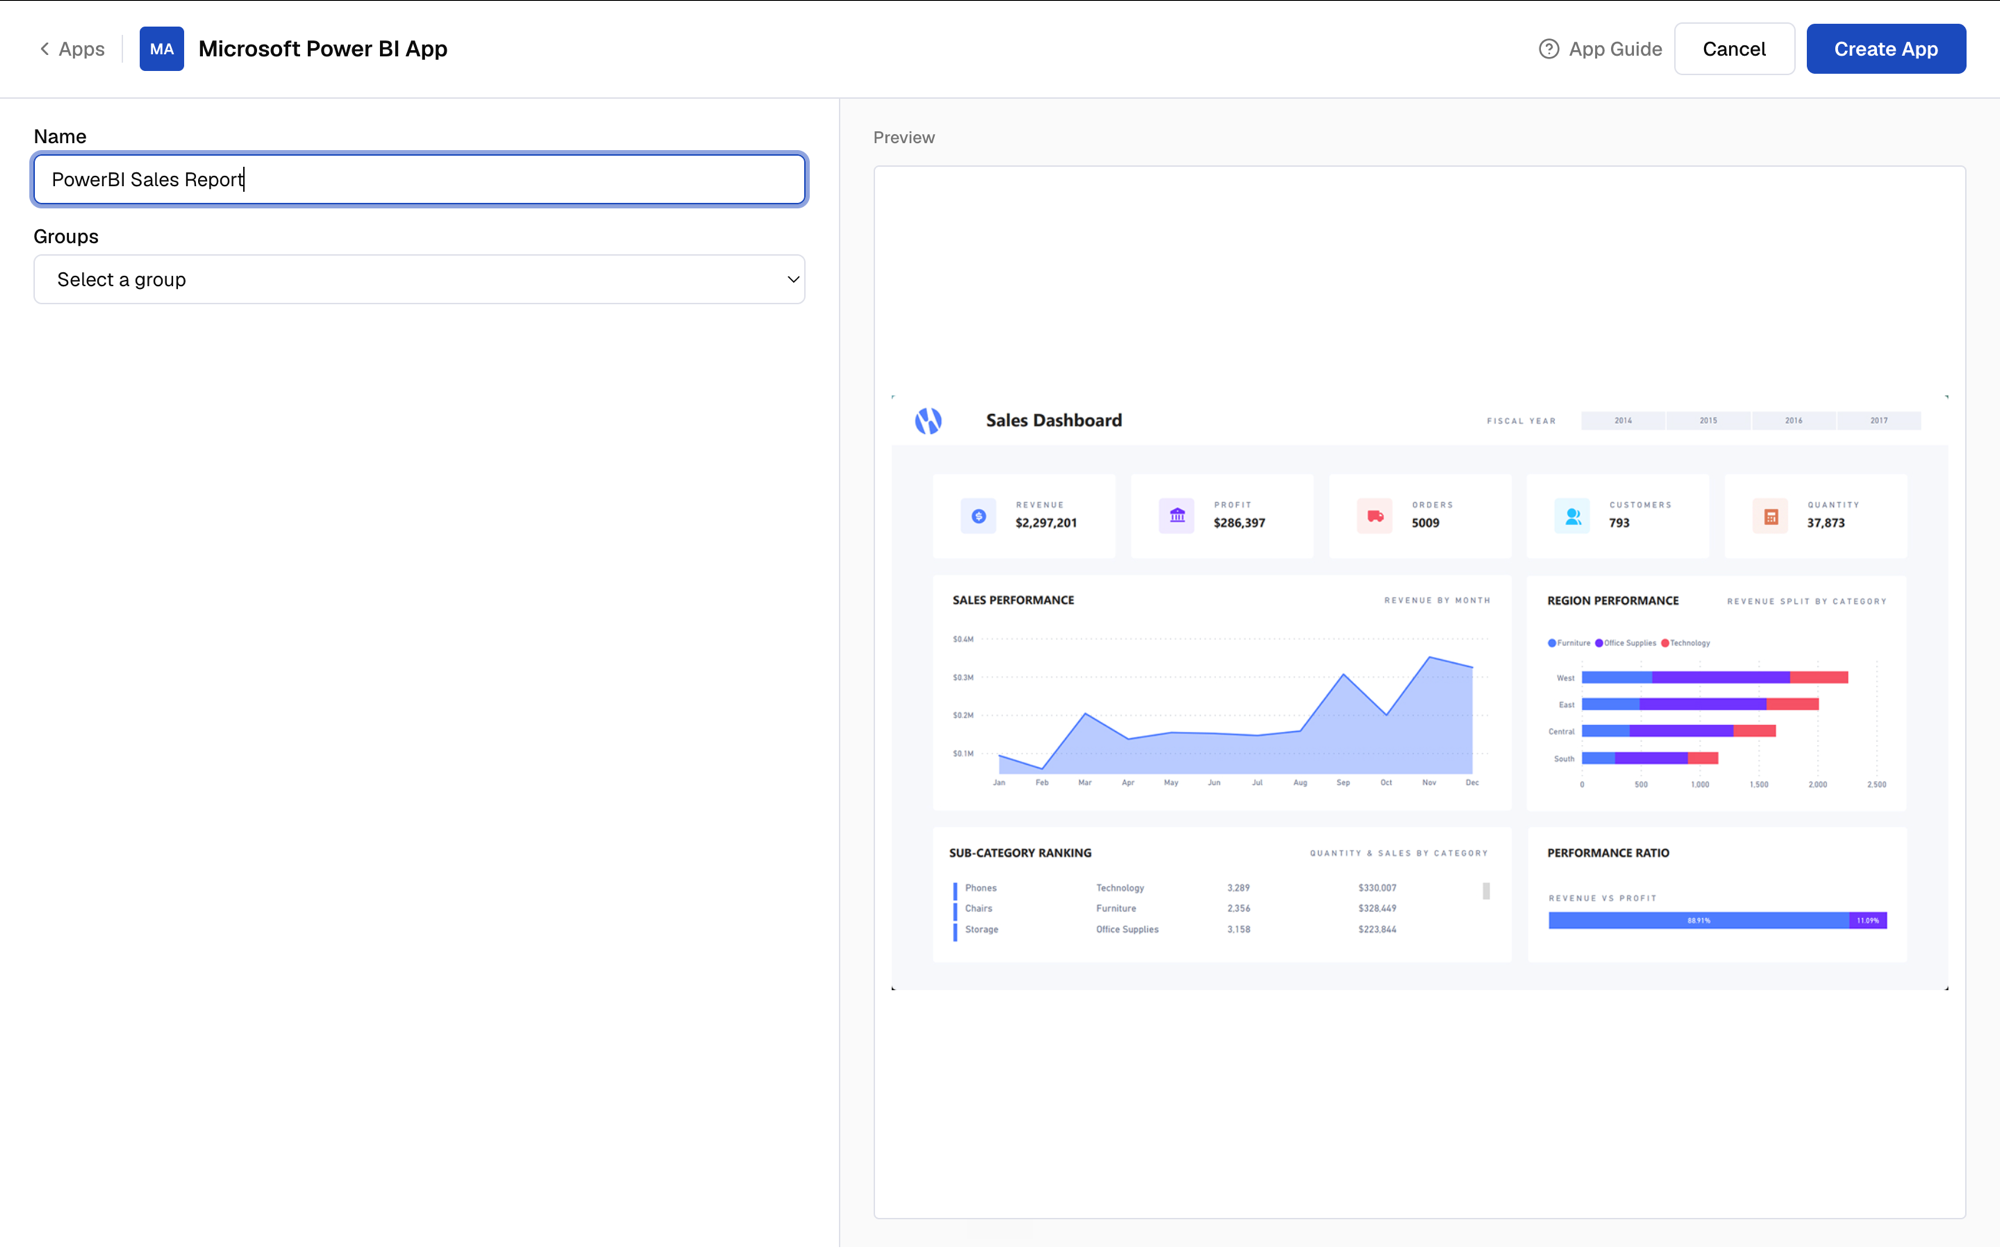
 Inside the workspace you can see the reports, semantic models, and dashboards it contains — the reports are what Pickcel can display.
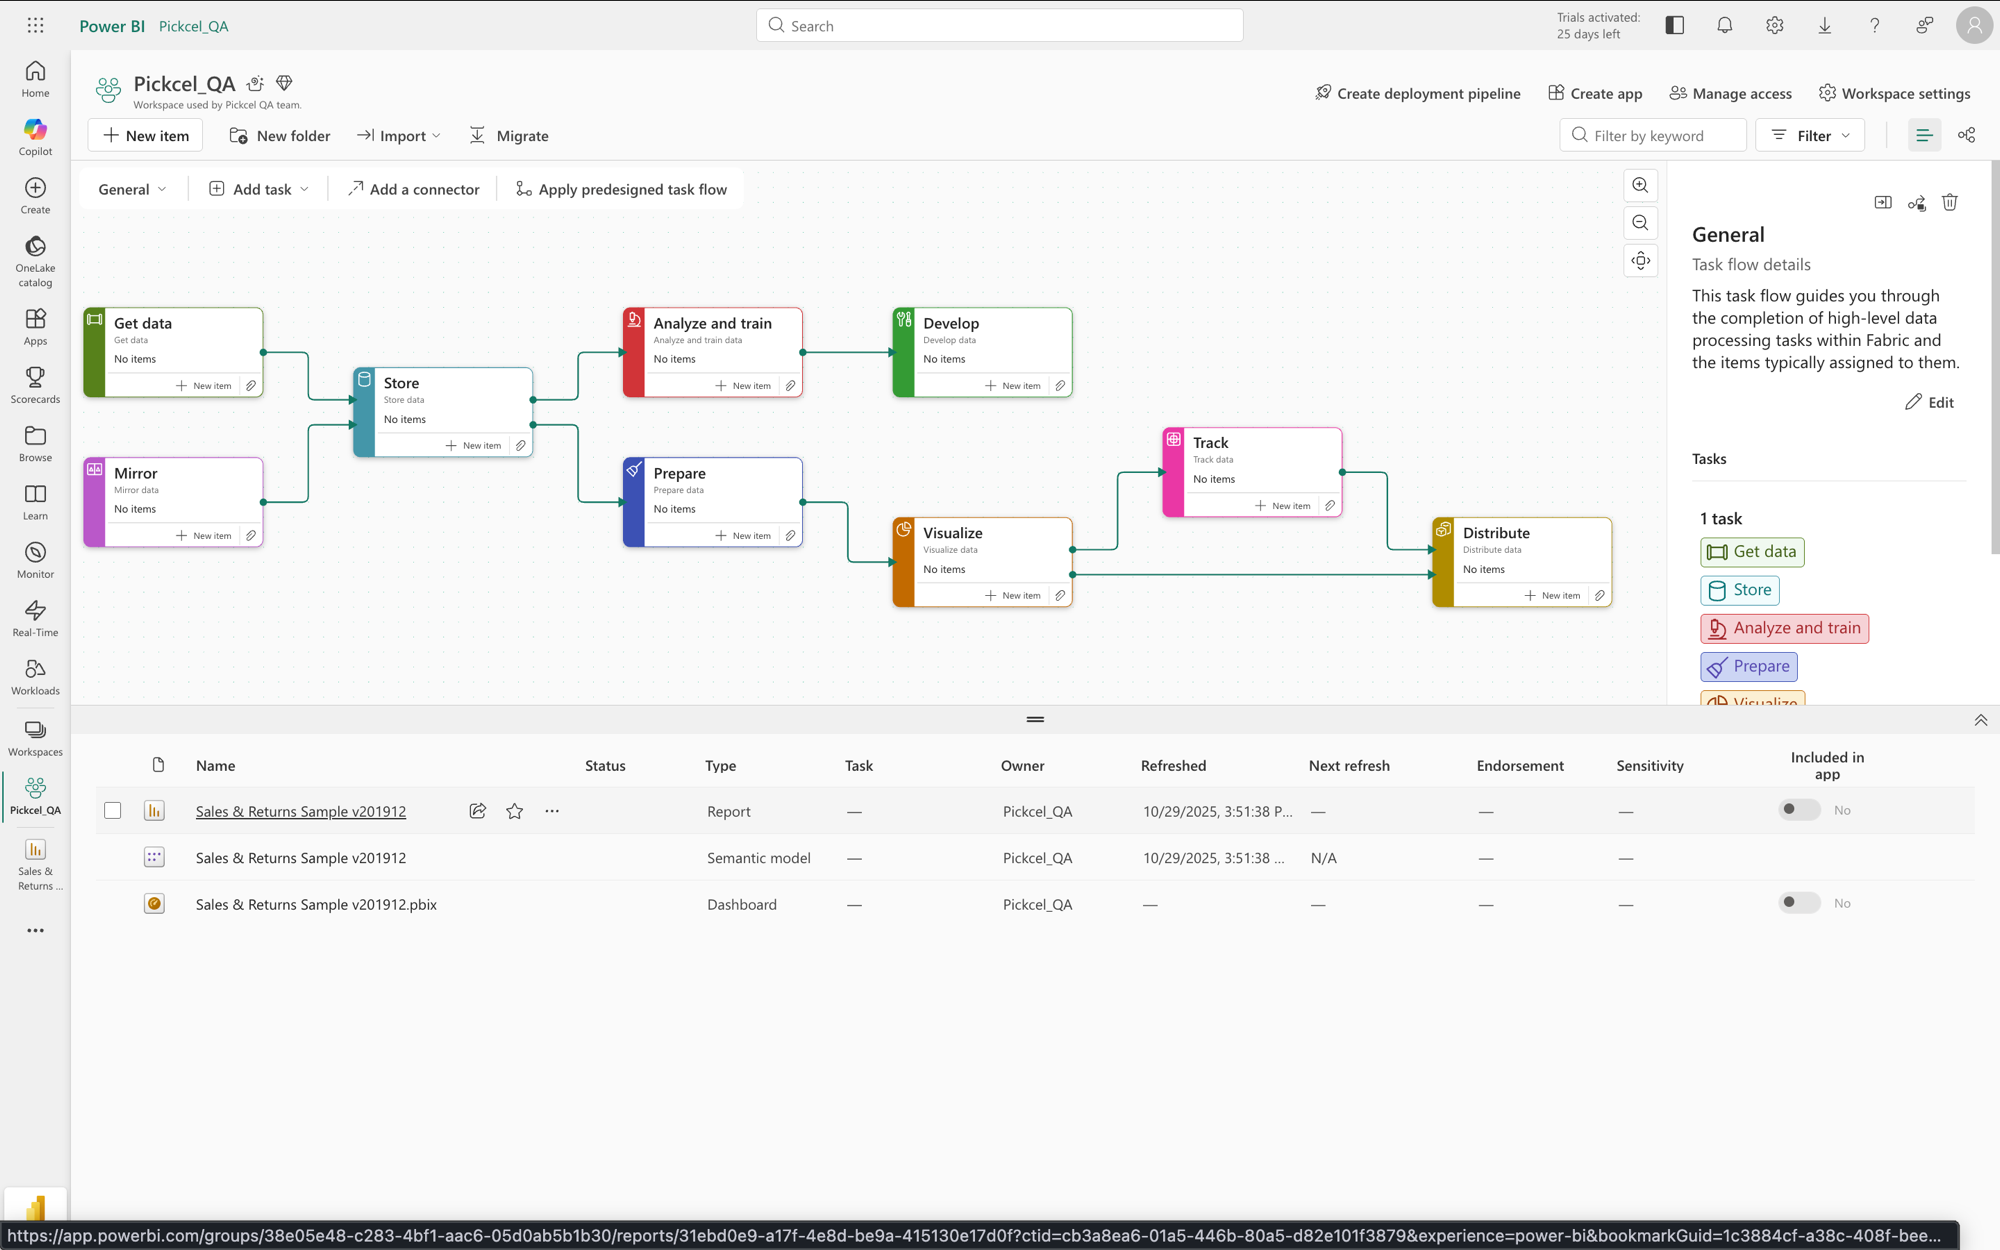 If you don’t have a workspace yet, create one in Power BI and move the reports you want to display into it. The workspace will then be available as a group in the Pickcel Power BI app, so you can pick its reports and show them on your digital signage screens.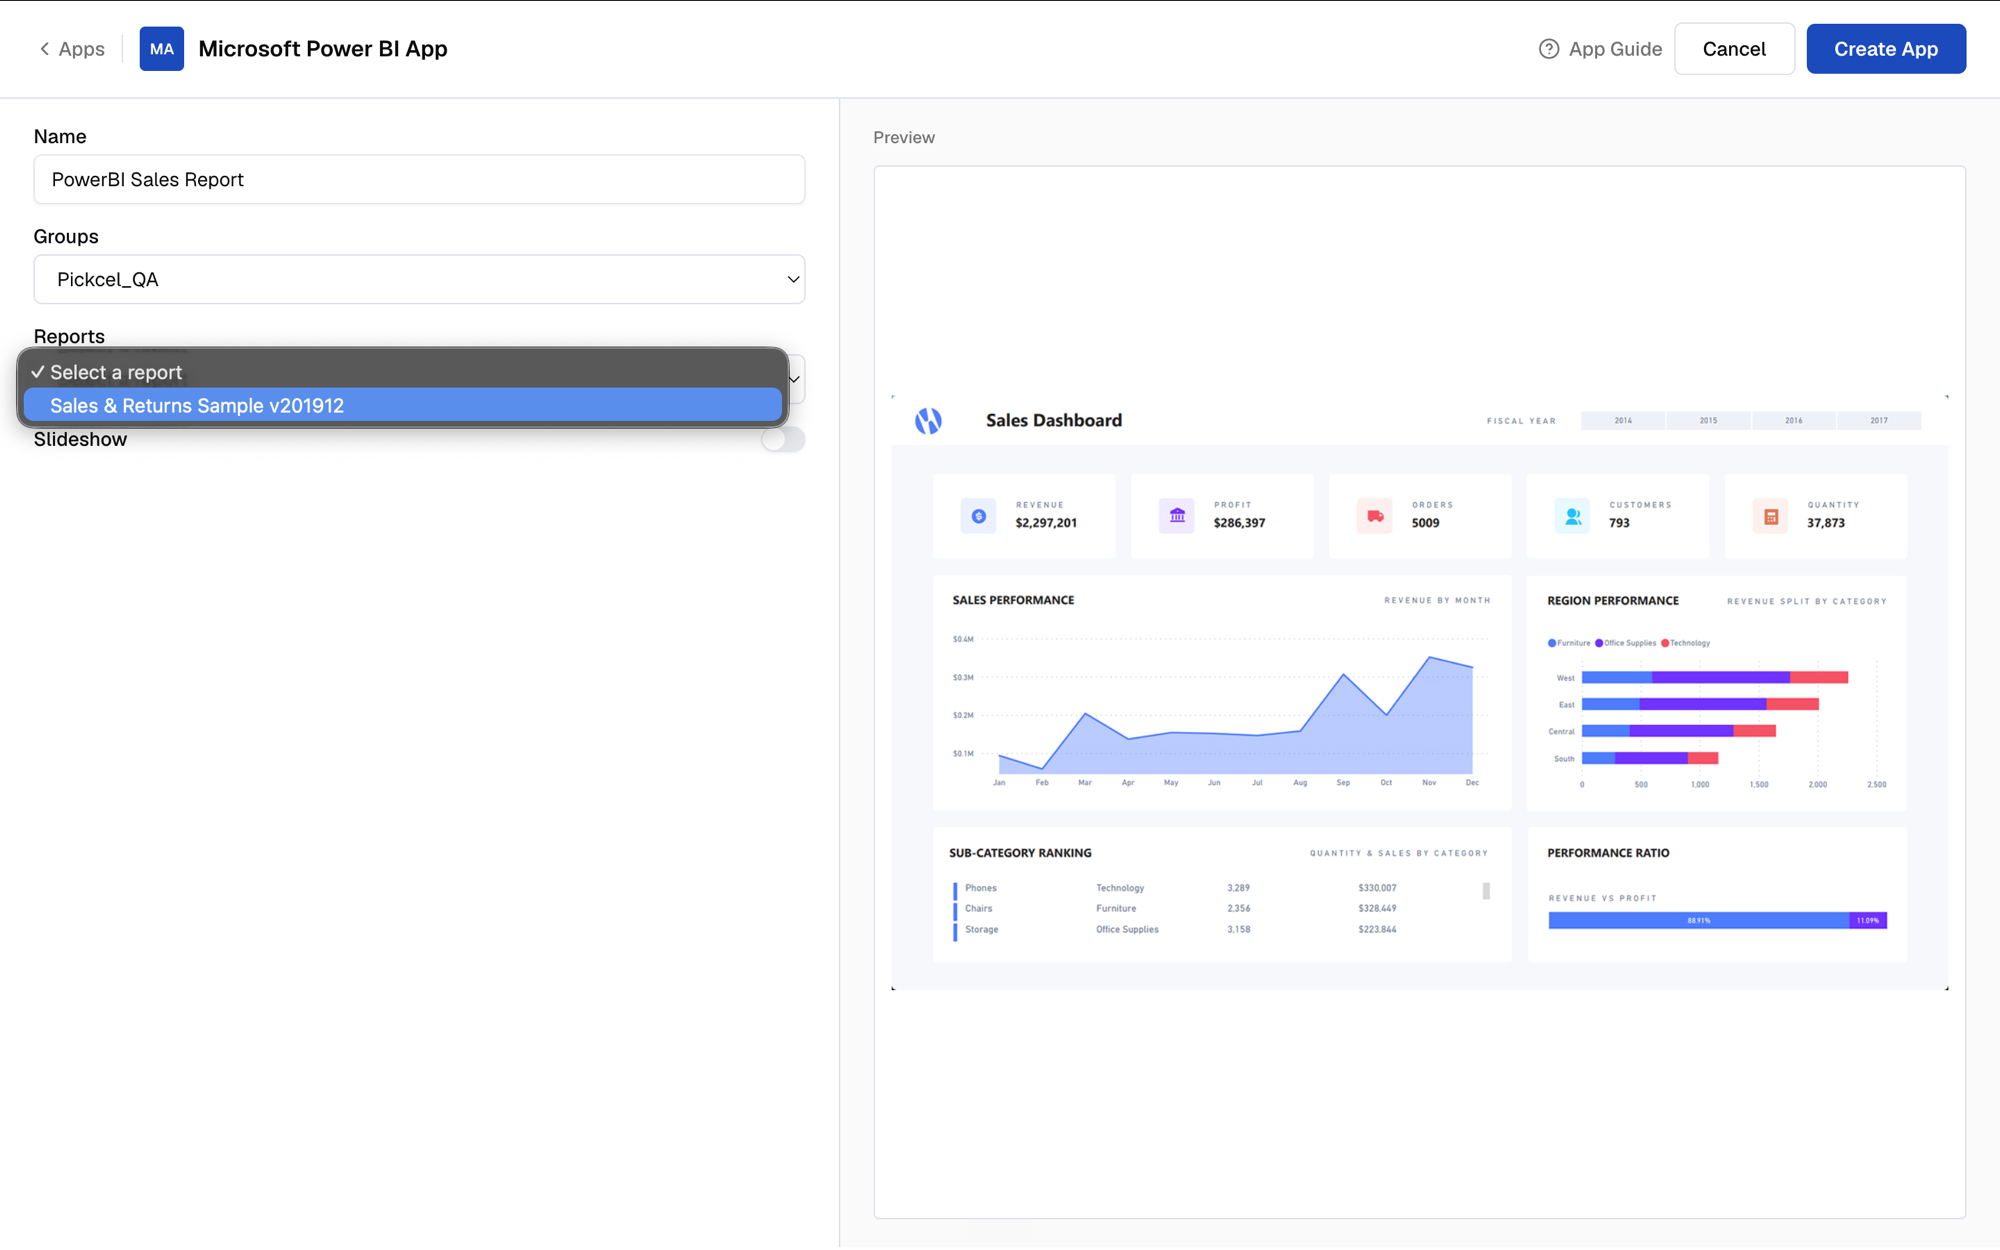
 A confirmation appears once the app is created — it is saved to your Media library.