Open the Reports module
From the left sidebar of the Pickcel console, click Reports to open the reports hub. Screen uptime sits under Screen & Operations.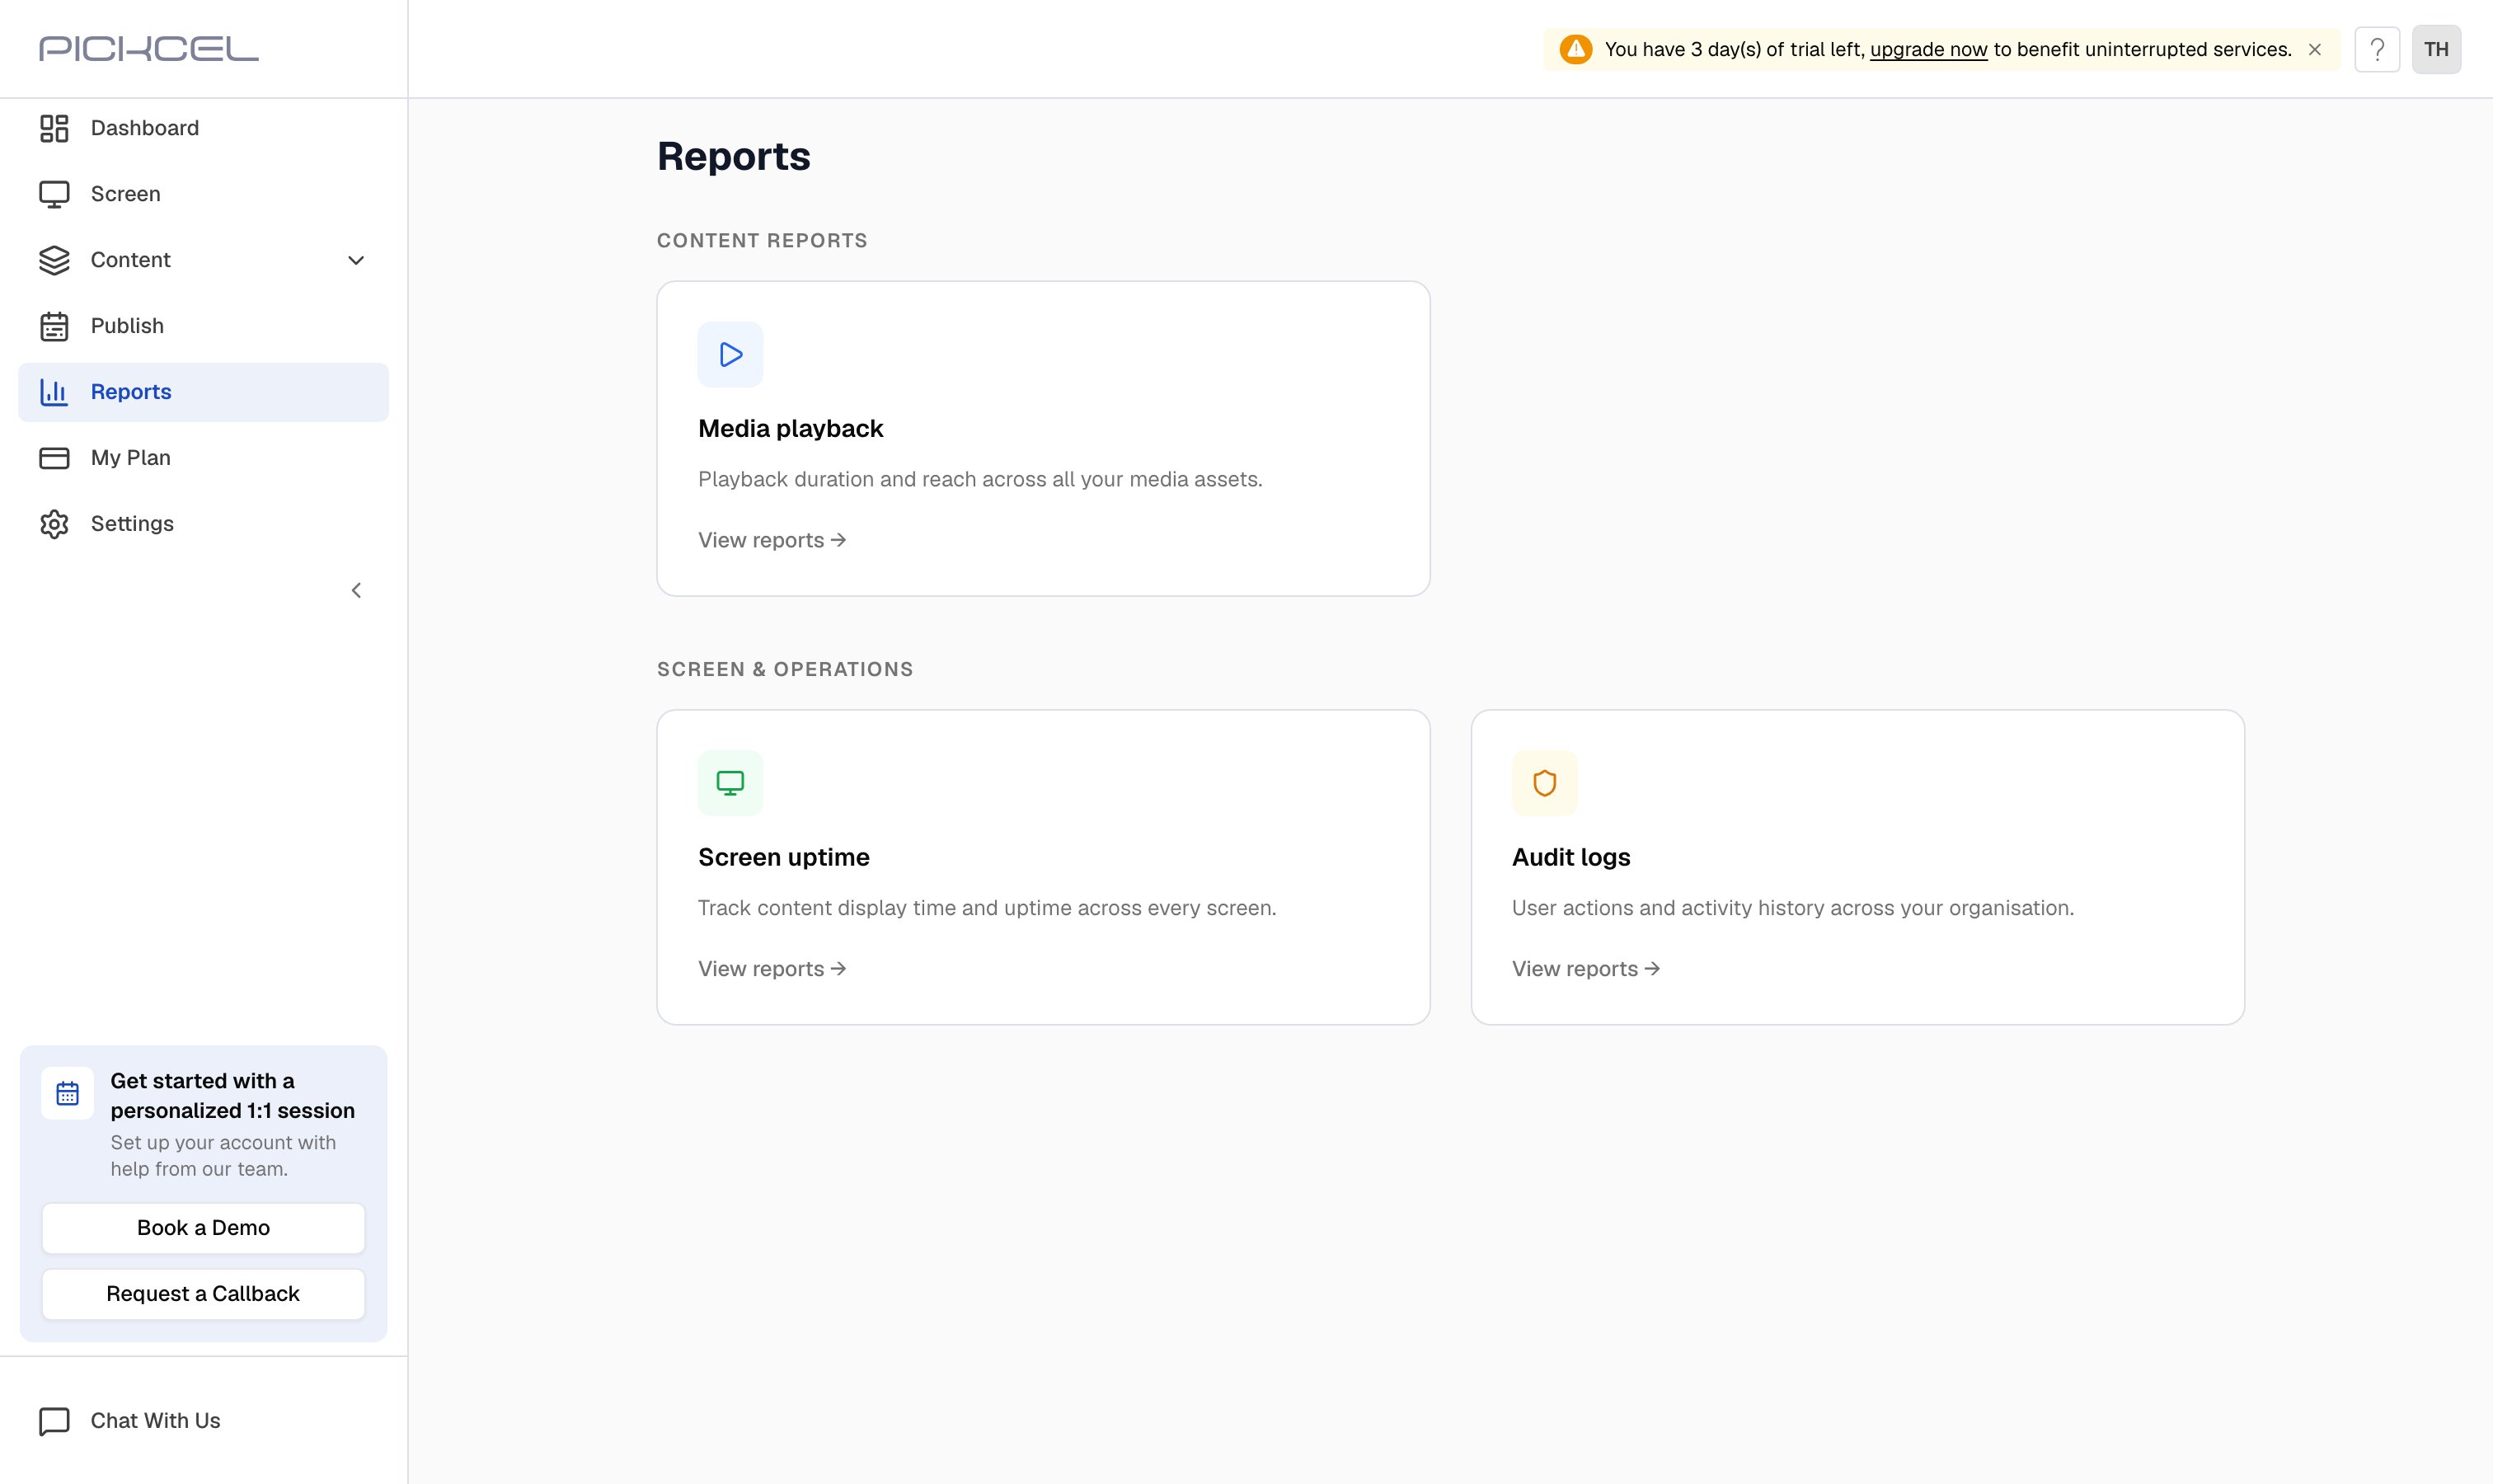
Open the Screen uptime report
On the Screen uptime card, click View reports. It opens straight to the period picker.
Choose a date range and continue
Pick how you want to generate the report, then click Continue: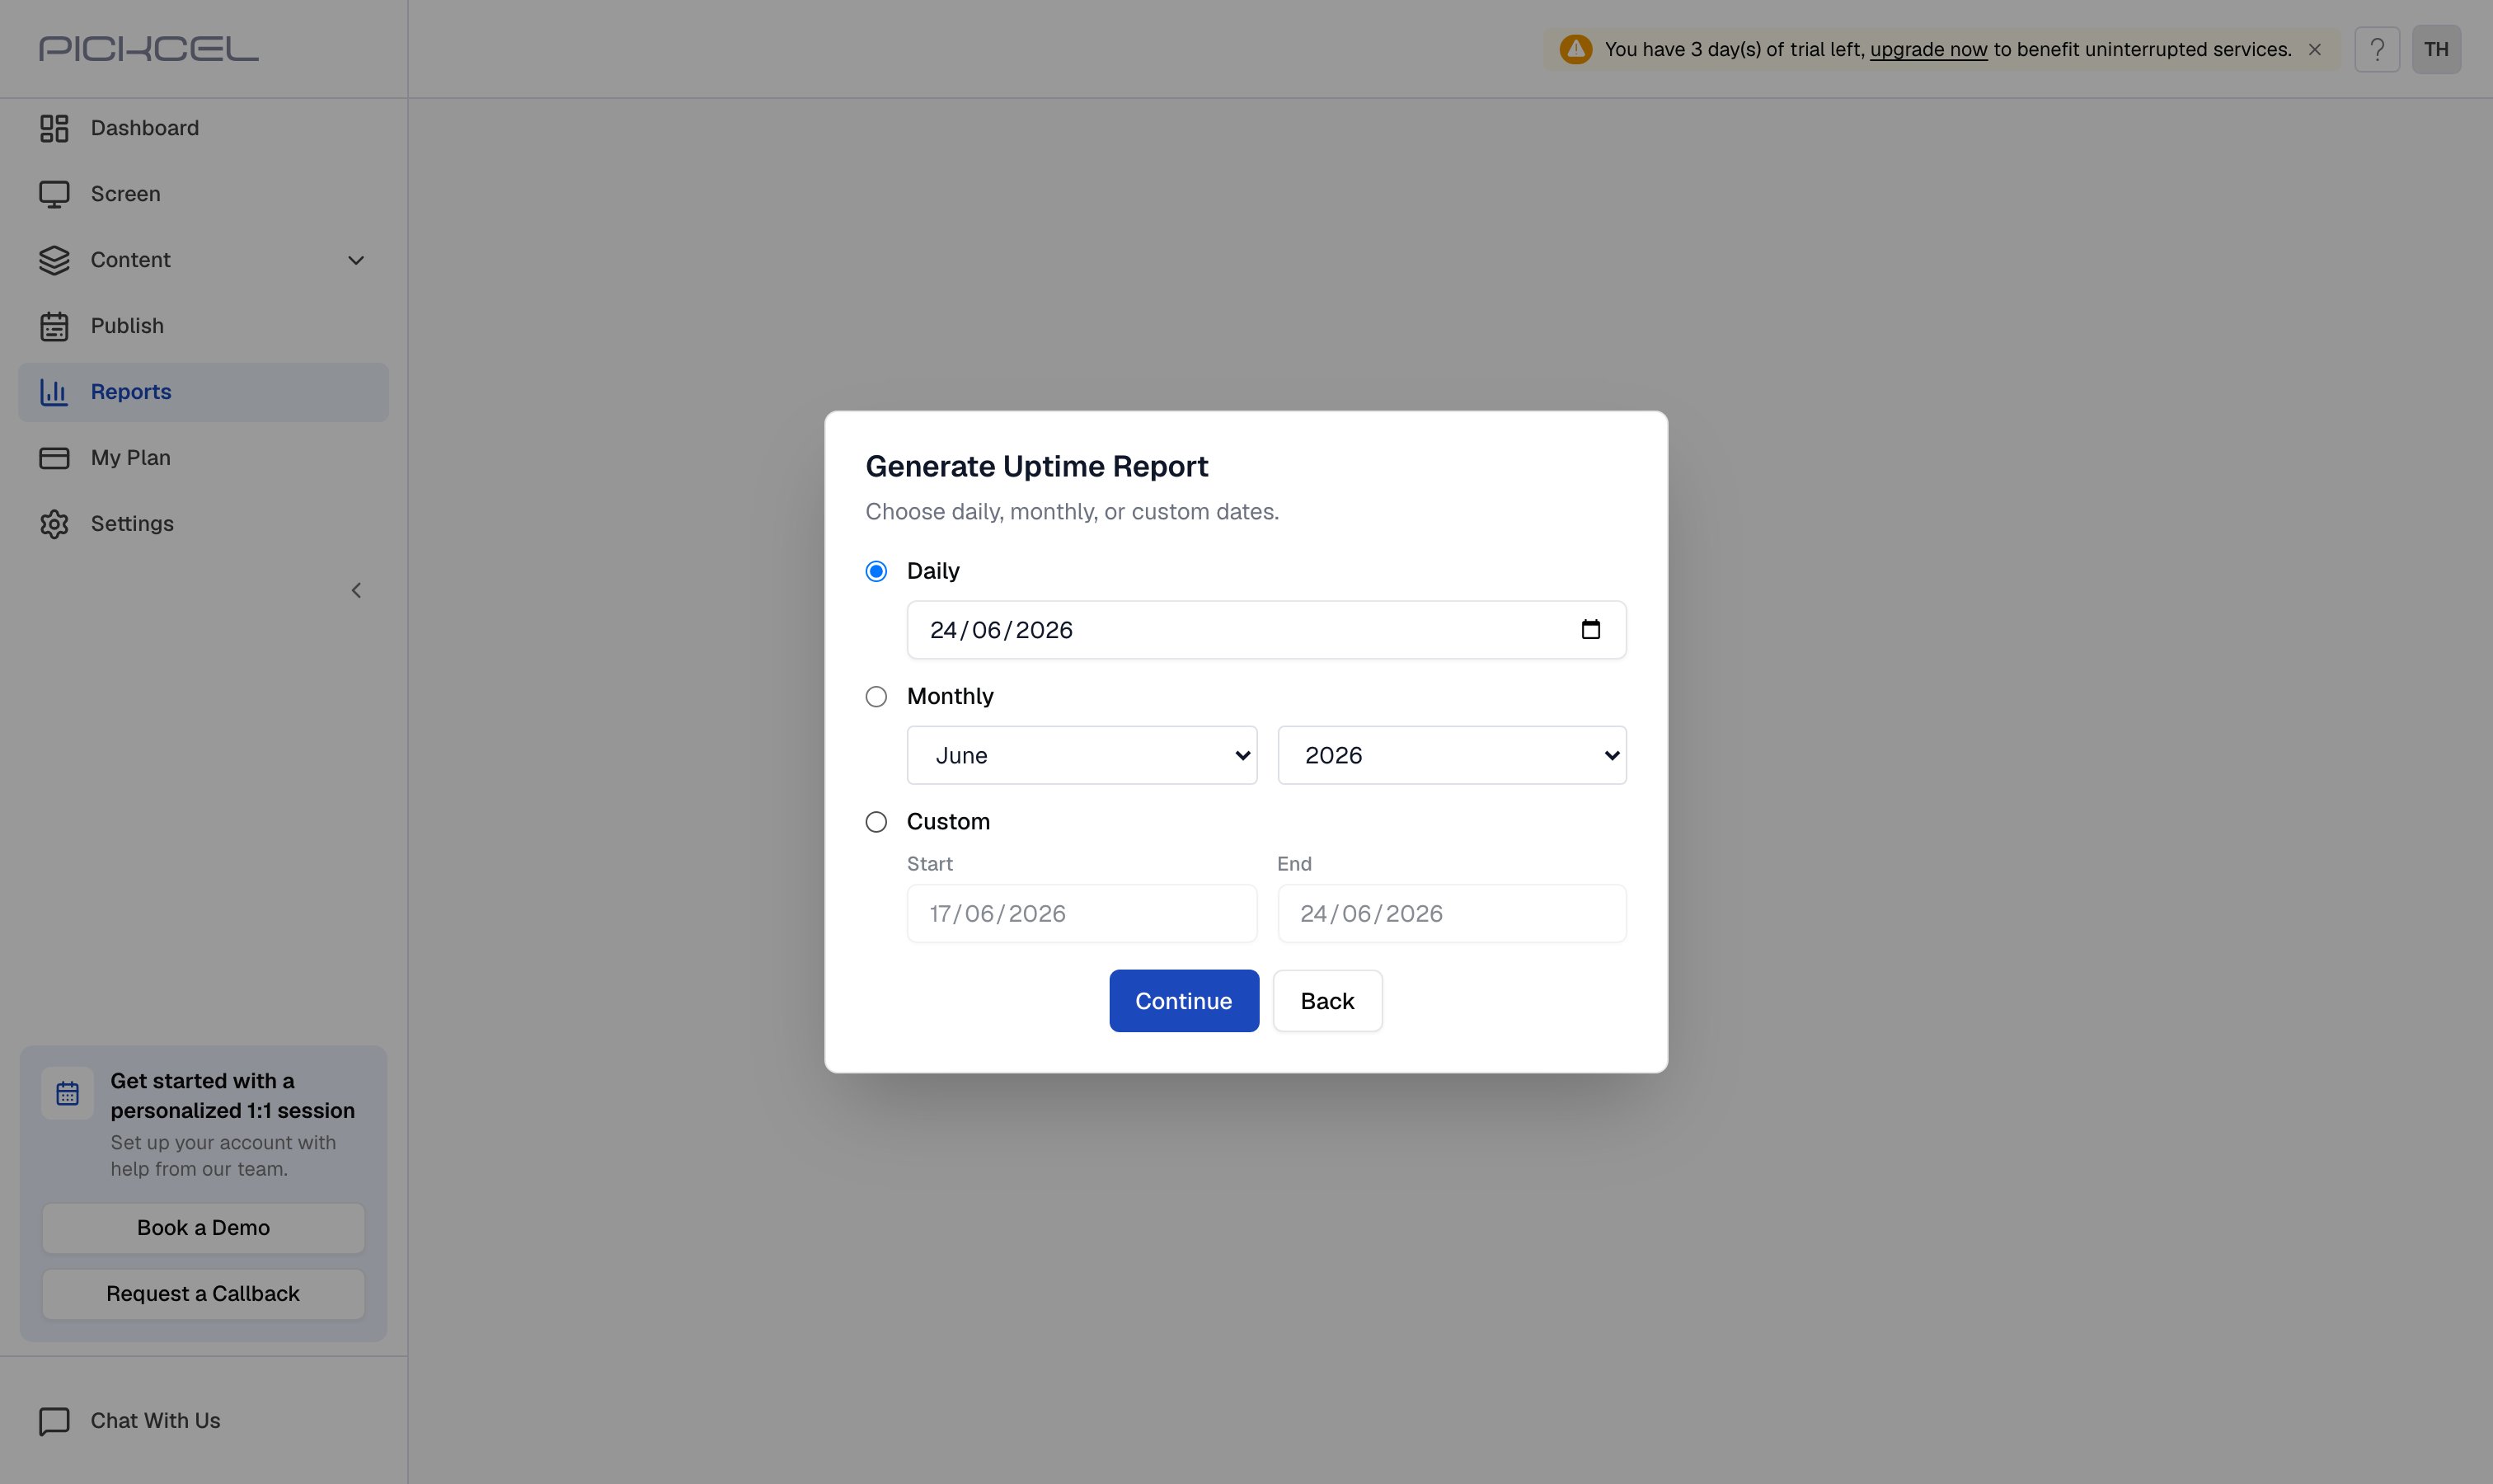
- Daily: select a single date from the calendar
- Monthly: select a month and year from the dropdowns
- Custom: select a start and end date for any period
Review the uptime report
The report lists every screen with its Total Uptime and Average Uptime for the period you selected. Use the search box to find a specific screen, or the filter to narrow the list by tag.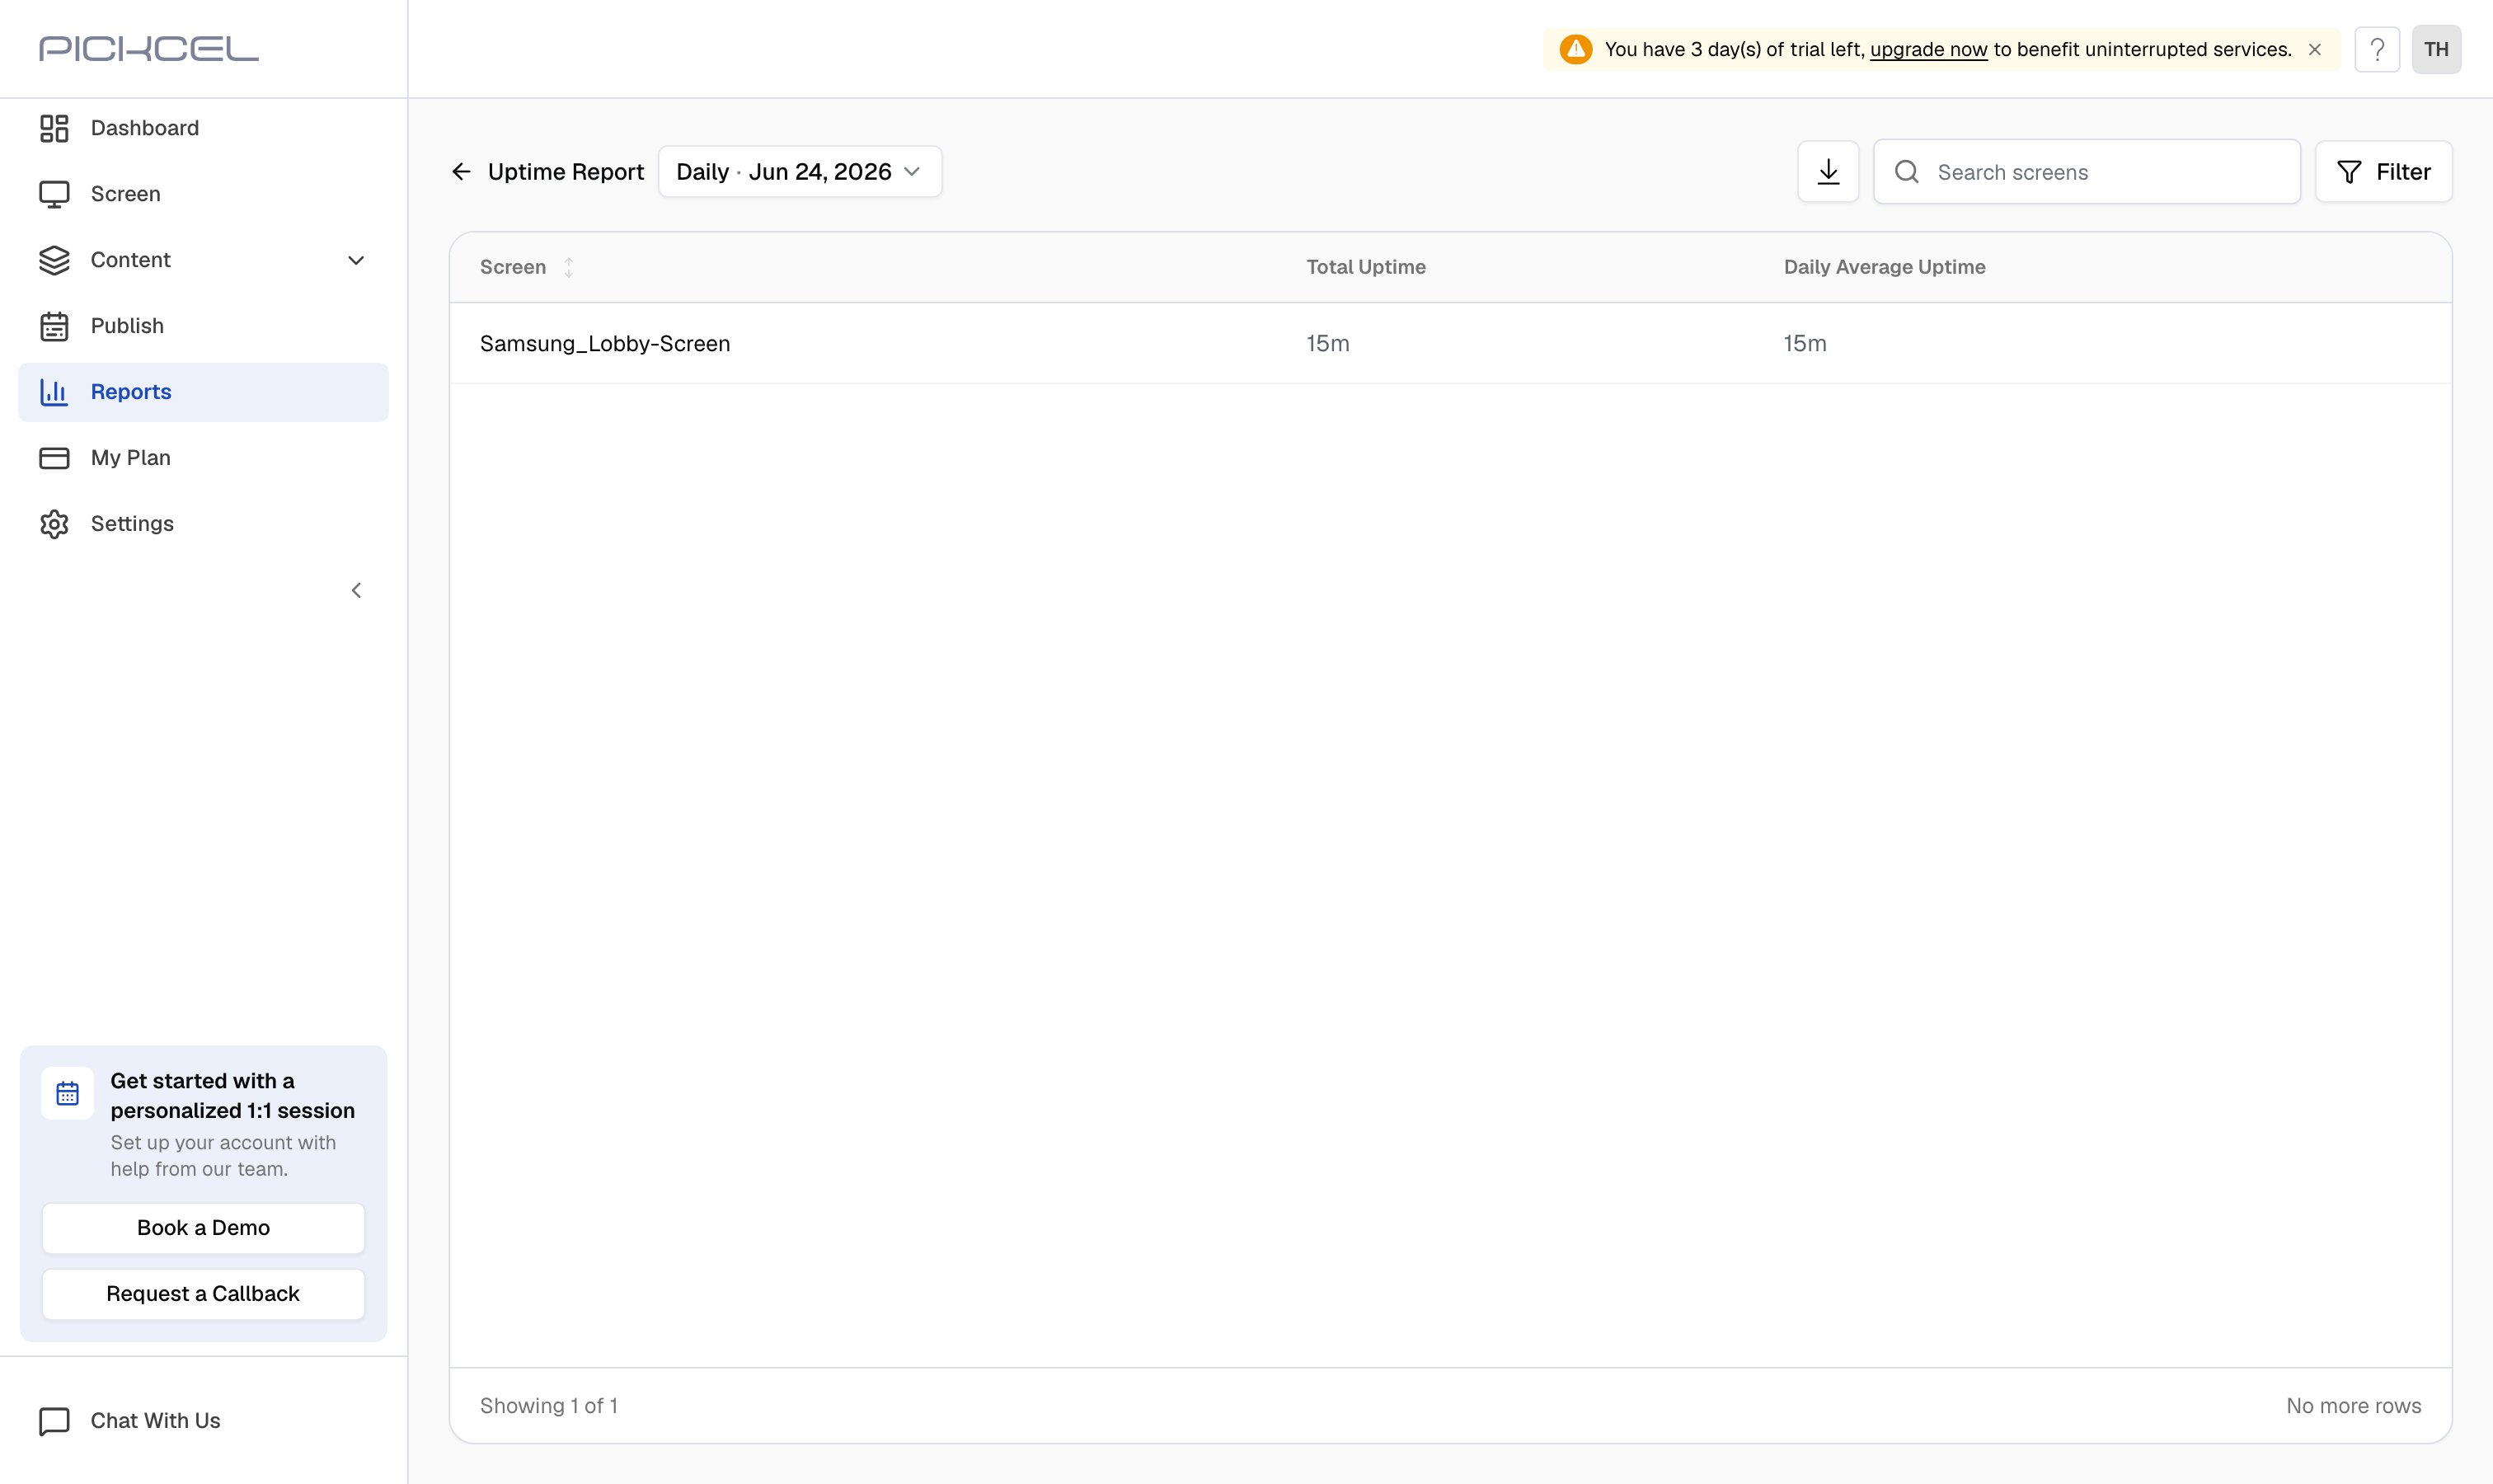
Download the report
Click the download icon at the top of the report to save a copy to your computer.
Review the downloaded report
The downloaded file is more detailed than the on-screen table. For each screen it includes:
- Display Name: the screen’s name
- MAC ID and Public IP / Private IP: device network identifiers
- Android APK Version and Android SDK Version: player and OS build (for Android devices)
- Tags: any tags assigned to the screen
- Last Sync Time: when the screen last contacted the server
- Total Uptime and Avg Uptime: totals for the selected period
- A column for each day in the selected range, showing how long that screen was up on that date
Frequently asked questions
What's the difference between Total Uptime and Average Uptime?
What's the difference between Total Uptime and Average Uptime?
Total Uptime is the combined time a screen was displaying content across the selected period. Average Uptime is that total spread across the period, shown as Daily Average Uptime for a day, and the monthly or period average for the Monthly and Custom options.
Which date range should I choose?
Which date range should I choose?
Choose Daily to check a single date, Monthly to review a whole month, or Custom to set any start and end date, for example, a specific week or campaign window.
Can I download the uptime report?
Can I download the uptime report?
Yes. Once the report is generated, click the download icon at the top to save it to your computer for sharing or record-keeping.
Related guides
Media Playback Report
See how long each media file played across your screens.
Dashboard
Get a live overview of screen health and activity.